


Volatility is the variability of the return. This variability is measured by the standard deviation of the return with continuous interest rate payments. Volatility is usually calculated from the daily closing prices, but weekly, monthly, hourly, or even minutely data could be used. If volatility is constant, it doesn’t matter what data is used, because the [latex size="1"]\Delta T[/latex]is the variance per time unit [latex size="1"]\sigma ^{2}\Delta T[/latex], and it is possible to calculate the value of [latex size="1"]\sigma[/latex] from that. The formulas needed to calculate volatility is the following:
[latex size="1"]z_{t}=ln(\frac{S_{t}}{S_{t-1}})[/latex] [latex size="1"]V=\sigma ^{2}\Delta t=\sum_{k=1}^{n}\frac{(z_{t}-z)^{2}}{n-1}[/latex]
where n is the number of observations.
[latex size="1"]\sigma =\frac{\sqrt{V}}{\sqrt{\Delta t}}[/latex]
The default time unit years. When using weekly data the following amendment must be made: [latex size="1"]\Delta t= \frac{1}{52}[/latex]. If [latex size="1"]\sigma _{weekly}[/latex] indicates the weekly volatility calculated from weekly data, then the relationship between weekly and yearly volatility is
[latex size="1"]\sigma =\frac{\sigma _{weekly}}{\sqrt{\frac{1}{52}}}=\sigma _{weekly}\sqrt{52}[/latex]
When volatility is calculated from daily data, then the formula to adjust the result is:
[latex size="1"]\sigma =\sigma _{daily}\sqrt{252}[/latex]
252 is used because there are approximately 252 business days in a year and statistical analyses show that market prices are more dependent on the stock exchange business days than on calendar days (on weekends, the market price changes are significantly lower than on workdays). It is important to note at this point that the n number of observations does not equal to how many parts one wants to divide the analysed period.


The higher the volatility the higher the fluctuation in the market prices. Statistical volatility is the percentage value of the price fluctuations determined by statistical methods. Traders and analysts examine the normal distribution of the closing market prices in a given period to determine the value of the statistical volatility. When assuming the price cannot be zero or negative, lognormal distribution may be a better choice, but it requires more data processing. The 22.6% volatility is simply the standard deviation of the price ratios’ lognormal sequence on the 252nd business day and this is how one can get the yearly statistics. The sequence can be formed from the closing prices on 20 days when this period can realistically reflect the market price fluctuations. More or less than 20 days’ data can be used as well to build the sequence, but it is highly recommended to use a 15-20 days long period as a basis to get a statistically acceptable result. When the volatility of the underlying is 10%, then the price of the underlying during the year will move between
- -10% and +10% with 68% probability,
- -2 x 10% and +2 x 10% with 95.4% probability,
- -3 x 10% and +3 x 10% with 99.7% probability.
The table below summarises the statistical volatility for different periods. It is interesting to see that the 10 day’s 19.34% value is small. However, the 43.03% for the 120 days is relatively high. The chart illustrating volatility shows that the 30 day volatility has decreased from 72% to 19.83% from October to March. The decreasing volatility is accompanied by an increasing share price.
| Historical volatility | ||||||||
| Period | 10 | 20 | 30 | 60 | 90 | 120 | 150 | 180 |
| Volatility | 19.34 | 21.74 | 19.84 | 20.81 | 28.21 | 43.03 | 41.50 | 42.47 |
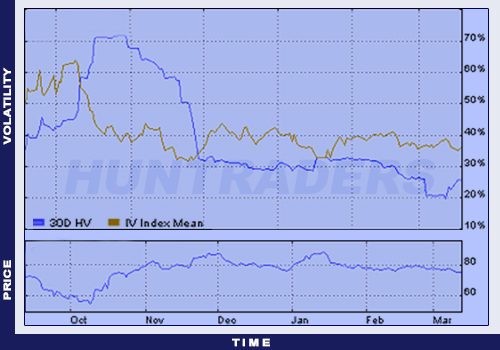
Historical volatility, IV index and market prices for the IBM shares
To conclude, historical volatility measures the relative price movements of the underlying. It is a mathematical expression, which shows (in a % value) how much the product’s price has moved upwards or downwards in the examined period. The statistical volatility of a product is constantly changing. The value should be recalculated on a daily basis, because the results can change significantly from one day to the next. Thus, it is common to calculate a 10 or 20 day moving average to help future analyses. This moving average will be used later to calculate fair value for the different option valuation models. In practice, it can be used to estimate how probable is a given change in market prices. If the statistical volatility and the current market price of a future contract are known, then the probability of the price reaching a certain level can be calculated.