


One might think that an underlying has a specific volatility for a given period and the volatility of options with different strike prices equals to that value. It is easy to understand that the volatility is different for options with different expirations. However, it seems strange that options with same expirations but different strike prices have different volatilities. Yet, this is the case. This phenomenon is called the volatility smile. It is also important to introduce the term structure of volatility.


The volatility smile is the chart illustrating the volatility of options with the same underlying and expiration and different strike prices. The X axis shows the strike prices.
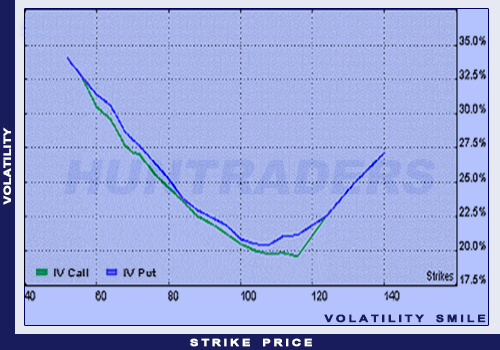
Volatility smile
The term structure of volatility is a chart illustrating the volatility of options with the same underlying and strike prices but with different expiry dates.
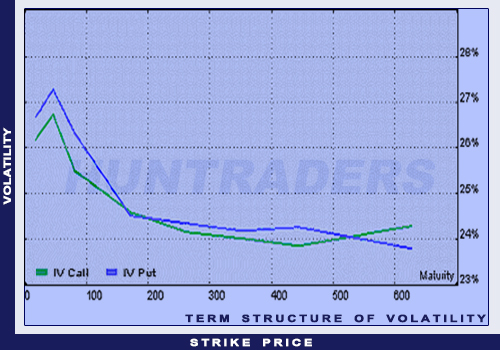
The term structure of volatility for ATM options on the DJX index
In the Black-Scholes model both charts are horizontal lines. In reality, the volatility is the smallest where the strike price equals the underlying’s price. The volatility is higher where the strike is lower and higher than that point. In that case, the chart “draws” a smile. However, it can happen that one of the ends of the curve turns to concave. Then the smile is called a volatility smirk.
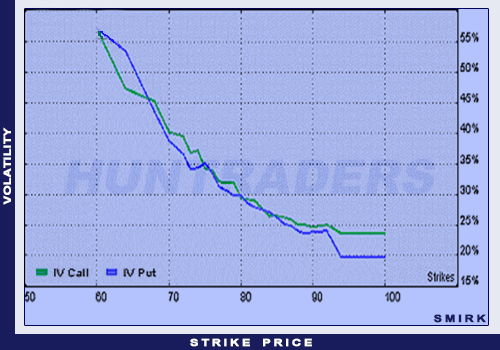
Volatility smirk on the DJX index (maturity: April 2003)
The volatility matrix is a table illustrating the volatility of options with the same underlying with maturity and strike prices being variables.