


To understand deals on the stock exchange, one has to understand risk graphs and their use. Generally, Y axis indicates the price and X axis indicates the time. This is not the case for risk graphs. Here are some examples to illustrate how they work.
Open a long position on a share for $25. The X axis on the risk graph shows the price of the share and the Y axis shows profit/loss values. The risk graph of the share purchase is a straight line with a 45 degrees angle from the horizontal line.
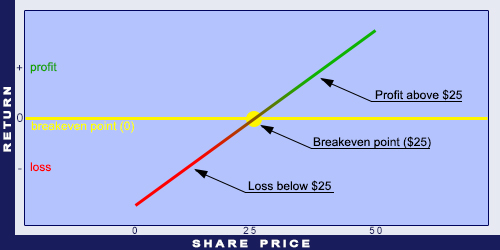
Underlying long position


Open a short position on a share for $25. Short means to sell something without actually owning the item. Opening short positions is allowed only on certain markets, for example in the US. In the UK it is not permitted. It is crucial to know that there are no limits on losses when opening short positions. Hence, the risk graph is going to look like the illustration below.
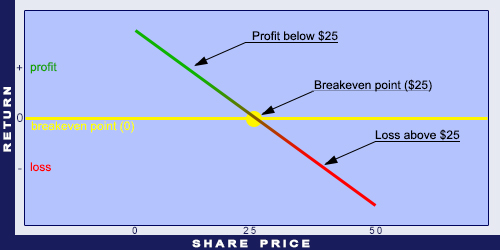
Underlying short position
Let’s see the risk graph of a Call option. Call option gives the right, but not the obligation, to buy the underlying at a specified price before the maturity date. Buy a Call option with the strike price of $25 and the maturity of December. The option premium is $3.50.
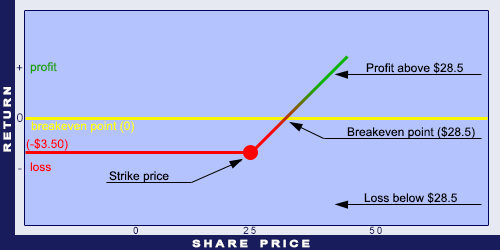
Long Call position
Now let’s see the same for a Put option. Put option gives the right, but not the obligation, to sell the underlying at a specified price before the maturity date. Buy a Put option with the strike price of $25 and the maturity of December. The option premium is $3.50.
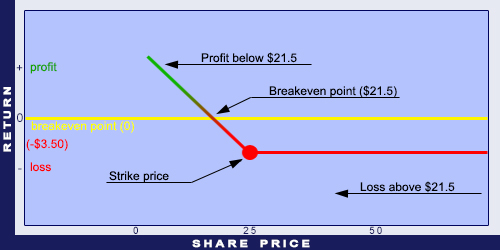
Long Put position