


Market prices of shares in a given period can show cyclical tendencies. Cycles are made up by an upward trend, immediately followed by a downward trend. Cycles are formed by primary cycles which develop in longer term. Within them, secondary cycles are found. Primary cycles are usually built up by five secondary cycles. Three of these secondary cycles have the same direction, the other two are in the opposite direction.
In case of an upward trend, the support line is drawn by connecting the throughs (minimum points). Connecting the peaks (maximum points) gives us the resistance or channel line. Whereas, in case of a downward trend it is the opposite: the support line is drawn by connecting the peaks and the resistance line is drawn by connecting the minimum points. A trend is upward, if the peaks are getting higher and higher. A trend is declining if the throughs are getting lower over time. When the market price goes outside the channel (resistance and support lines) and stays outside by the end of the day, it is called breakout. If the breakthrough does not exceed 2%, it is called a “dead” breakout.


Elliott cycle
Markets have wavelike movements, according to the analysis method based on the Elliott Wave Theory. Movements have two main phases: impulsive and corrective waves. The impulsive phase contains 5, the corrective phase contains 3 wave sections. The peaks of the impulsive phase’s waves are always higher than the previous peaks, until the corrective phase starts. Elliott waves behave fractally, meaning that more smaller Elliott waves can add up to a big one. Therefore, waves can be analysed in short-, medium-, and long-term as well.
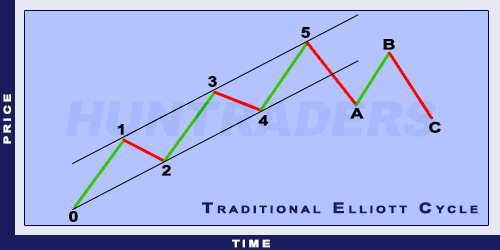
Traditional Elliott Cycle
The Elliott Wave Theory distinguishes between 9 types of waves based on their size:
- Grand Supercycle (multi-centrury)
- Supercycle (multi-decade)
- Cycle (one year to several years)
- Primary (few months to a few years)
- Intermediate (weeks to months)
- Minor (weeks)
- Minute (days)
- Minuette (hours)
- Sub-Minuette (minutes)
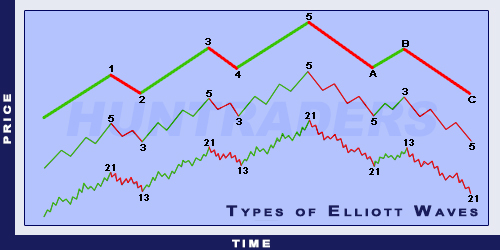
Types of Elliott Waves
Elliott Wave Theory works the following way
- 1st wave: The appearance of the first wave does not immediately mean the beginning of an Elliott Wave. When the first wave appears, the news on the market are usually not optimistic. The previous trend is still in effect. Analysts are occupied with the calculation of low returns and the economy is still considerably weak. The market is still bearish, put options are frequent, and the options market is characterised by high implicated volatility. Because of the rising market prices, trading volume will slightly increase.
- 2nd wave: The second wave is a correction, but it never falls below the starting point of the first wave. The news on the market are still pessimistic. As the market prices drop, the decreasing market perception will take place. However, when investigating the situation deeper, one can see positive signs: the trading volume is smaller in the second wave and the prices do not drop below 61.8% of the first wave. To put in other words: the correction retrieves 1/3 of the impulsive phase.
- 3rd wave: The third wave is usually the largest and the most powerful. Market news turn positive and the analysts increase the value of predicted returns. The market price grows rapidly, the correction period is really short. At the starting point of the third wave, one can meet negative news. Most of the investors talk about decreasing market considerations at this time. Around the middle of the wave, investors realise the fact that a new upward trend has started. The ratio between the first and the third waves is usually 1.618:1. From this point, one can talk about the development of an Elliott Wave, because the basic criteria are met.
- 4th wave: It is the correction of the previous, impulsive wave. This wave shall never drop to the level of the first wave. The trading volume will stay considerably lower than the previous wave’s. The length of the third and fourth waves are the same. However, the length of the second and fourth wave can differ.
- 5th wave: The fifth wave is the last leg of the trend. The market is bullish and the market news are positive. This is the point when most of the investors buy. The trading volume is lower than it was in the third wave and most of the momentum indicators show divergences (the price reaches new peaks, while the markers of the indicators drops to new minimums).
- A wave: The market price breaks out of the channel. The news during the A wave are still optimistic. Most analysts think that it is a smaller correction of the upward trend. Some of the technical indicators move along with the wave. The A wave is characterised by increased trading volume, while the option market is characterised by increasing implicated volatility and an increasing number of open positions.
- B wave: The B wave is the correction of the previous wave. It regains its 50 or 61.8%. It may seem like the beginning of a new, long-term upward trend. Investors who are proficient users of technical analysis will recognise the right shoulder of the reversal head-and-shoulders. The trading volume is going to be lower than in the A wave. From this point, economic indicators do not increase further, but also do not reverse.
- C wave: In the C wave, the market prices drop sharply. In the same time, the trading volume increases. Around the 3rd part of the C wave almost everyone realises that a new downward trend has started. Usually the C wave has the same length as the A wave, but it can sometimes grow 1.618 times longer than the A wave. When the C wave drops below the A wave, the Elliott Wave is considered to be closed.
Trading signals
The first two waves of the Elliott Wave can be similar to a simple continuation pattern. If the second wave does not fall below the first wave, and the time period of the first two waves equal to the time period of the third, then the time of the breakout can be predicted with high punctuality. Then a long position can be opened. The breakout usually comes with high trading volume and usually a gap. Approaching the end of the 5th wave, a trading signal may be received. At this time the trading volume increases and then it suddenly stops. Reversals are signalled differently, but they need 2-3 weeks at least to develop.
Upward phase
Upward phases do not always show a regular Elliott Wave, however the first three waves are developed in the usual way in 80-90% of the cases. Irregularity has three common types.
- Extended Wave. Only the 1st, 3rd, and 5th waves can be more extended than the others. Extended means that these waves are prolonged. Thus, these waves are built up by other, smaller waves.
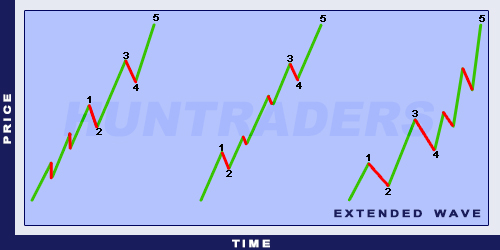
Elliott Extended Wave
- Diagonal Triangle at Wave 5. Sometimes the momentum of the 5th wave is as weak as the 2nd and 3rd waves altogether. Then the 5th wave “builds up” a triangle.
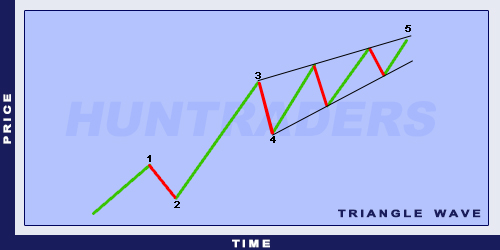
Elliott Diagonal Triangle Wave
- 5th Wave Failure. Under certain circumstances, the 5th wave can be so weak that it does not even reaches the top of the third wave. Then it forms a double top pattern at the peak of the Elliott Wave.
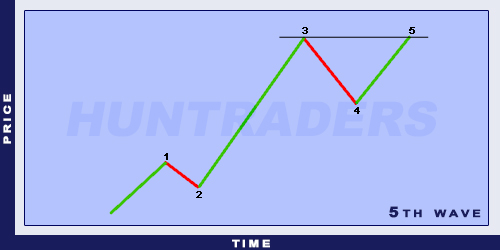
Elliott 5th Wave Failure
Correction phase
Trading with Elliott Waves is difficult, because the pattern can be only recognised only in 60% of the cases. In the rest of the cases the correction phase differs from the regular pattern.
- Zig-zag. The A point does not fall below the 3rd wave. Furthermore, the B wave takes back 50-75% of the A wave. The rest of the wave is regular. The C wave equals to the A wave 1.618 or 2.618 times.

Elliott Zig-Zag Correction
- Flat. The A wave is regular. The correction of the B wave extends to the top of the A wave. Therefore, the C wave will not reach a new minimum point. It will stop at the A wave’s minimum.
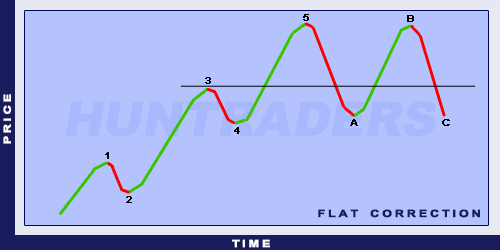
Elliott Flat Correction
- Irregular. This correction is the most irregular. The B wave’s peak is higher than the maximum point of the 5th wave. Usually there is no increased trading volume at the B wave’s top and the raise stops quickly. Then the C wave drops below the A wave’s minimum point. The B wave is 1,5 or 1.25 times the size of the A wave. The C wave is 1.62 or 2.62 times the size of the A wave.
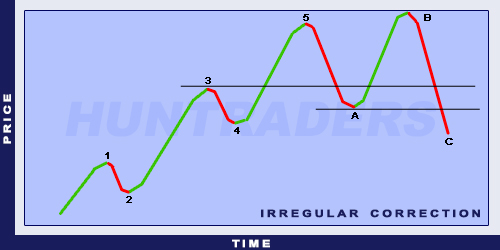
Elliott Irregular Correction
- Triangle. This correction pattern is made up by 5 smaller waves. These waves are the A, B, C, D, and E waves, and they make up a triangle. The breakout point is at the breakout of the B-D line’s breakout, which is below the peak of the C wave.
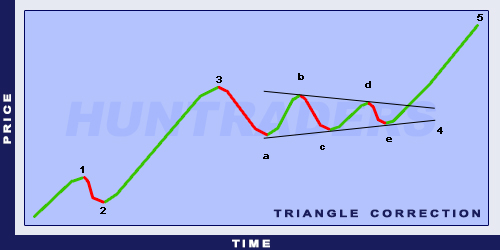
Elliott Triangle Correction
- Double Three. This type of correction is made up by two of the above mentioned 4, which are separated by an X wave from each other.
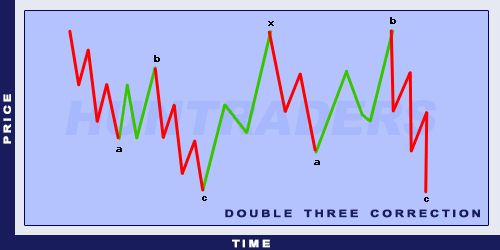
Elliott Double Three Correction
- Triple Three. This type of correction is made up by 3 of the above mentioned 4 corrections. They are also separated by an X wave from each other.
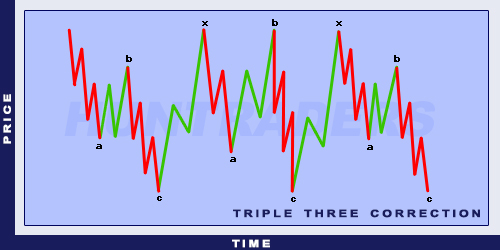
Elliott Triple Three Correction