


There are different types of charts to illustrate market prices. There are four different chart types introduced in this lesson.
Line Chart
Some traders and investors prefer to see the closing prices over seeing opening, minimum or maximum prices. This type of illustration is possible to use even if there are no other data available than the closing prices. The line chart is drawn simply by connecting the closing prices.
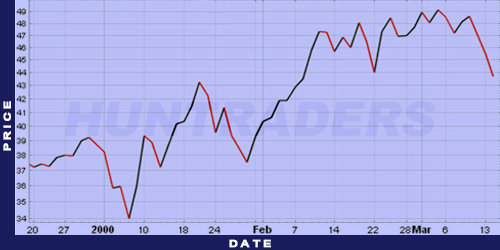
Line chart


Open-High-Low-Close (OHCL) Chart
OHLC chart is a type of bar chart. It shows the minimum, the maximum, the opening, and also the closing prices. The opening and the closing prices are indicated by horizontal lines.
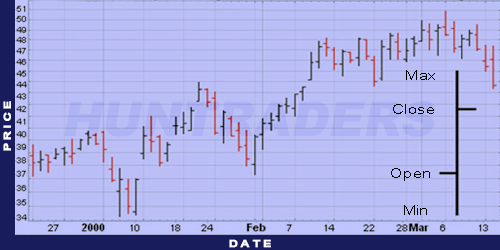
OHCL Chart
Candlestick Chart
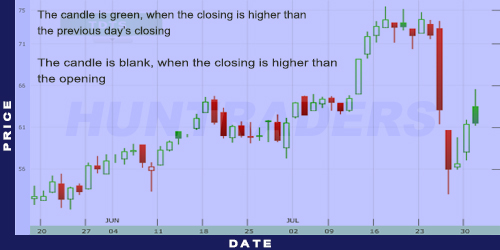
The first use of this chart type dates back to 300 years ago in Japan. Currently this type of illustration is quite popular. The minimum, maximum, closing, and opening prices are easily observable on candlestick charts.
Candlestick Chart
The interpretation of candlestick figures is the following:
- Green, filled bar: The current day’s opening price is higher than the closing price on the same day. The previous day’s closing price is lower than today’s closing price.
- Green, empty bar: The current day’s opening price is lower than the closing price on the same day. The previous day’s closing price is lower than today’s closing price.
- Red, filled bar: The current day’s opening price is higher than the closing price on the same day. The previous day’s closing price is higher than today’s closing price.
- Red, empty bar: The current day’s opening price is higher than the closing price on the same day. The previous day’s closing price is higher than today’s closing price.
The vertical lines above and below of the body of the candlestick indicate the maximum and the minimum prices. They are called the candlestick’s shadows.
Point & Figure Chart
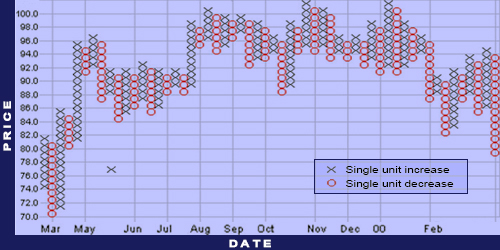
The popularity of the point and figure chart is in its simplicity. Every point illustrates a given time period. Thus, this chart shows the price changes and eliminates the time factor (there is no time axis, only a price axis). Every X or O takes a up a box on the chart. Every chart has a specific box size. The size tells how much the price has to increase (X) above or decrease (0) below the current box to make it to the new box. Every chart has a reversal amount as well. It shows how much the price has to move in the opposite direction before turning backwards. Before reaching the reversal point, a new column starts before the previous one, in the opposite direction. Small movements in the market price or still market prices do not result more figures on the chart.
Point & Figure Chart
To summarise: O symbolises falling prices, and X symbolises increasing prices. For example, $1 setting is frequently used for $20 or more valuable shares. This simply means that a 0 is drawn when the price of the share falls with $1. If it increases with $1, an X is going to be drawn.
The illustration helps to recognise support and resistance lines, and also breakouts.