The origin of candles
Technical analysis was first used in Japanese rice trading in the XVII. Century. Despite the several differences, Charles Dow theory (early 1900s) has fundamental similarities with it:
- “What”-s are more important than “why”-s (news, quarterly reports, etc) for the development of the market price.
- Every known information is incorporated in the market price.
- The sellers and buyers move the market based on their expectations and feelings (fear and greed).
- This market is unsteady.
- The current market price does not reflect the actual price (or value) of the underlying asset.
Candlestick visualisation has reappeared in the 1850s and has not stopped spreading ever since. The knowledge, the usage, and the correct interpretation of this chart type has changed and developed over the years.


Formation
One must know the opening, closing, maximum, and minimum values to draw the financial instrument for the analysed period. The core of the candle (whether filled or empty) is called the body. The lines above and below the candle are called shadows.
If the closing price is above the opening price, the top line of the body will show the closing price. If the closing price is below the opening price, the top line of the body will show the opening price.
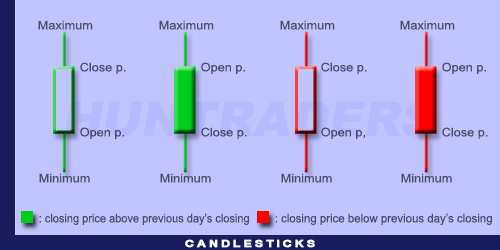
Illustrating the opening, closing, minimum, and maximum values with candlesticks
to other traditional line charts, candlestick visualisation tells more about the movements in the prices. The opening and closing price is directly and easily observable and comparable with the previous time periods. Candlesticks with empty bodies show that the closing price is above the opening price. They indicate a buying pressure. Candlesticks with filled bodies show that the closing price is below the opening price. They show a selling pressure.
Consecutive, individual candlesticks form groups or formations. The development of candlestick formations may take several years. They visualise the investor’s behaviour. Despite signalling a buy or sell action, candlesticks should not be used to trade without applying other measurements of technical analysis as well.