


The market prices of shares are usually following trends. One can distinguish between short-, medium-, and long-term trends. Long-term trends are shaped by market expectations, while the short-term ones are shaped by current news and events. Trends are illustrated on charts.
There are three main types of trends:
- Upward trend line (ascending trend)
- Downward trend line (descending trend)
- Horizontal trend line
In case of an upward trend, the support line is drawn by connecting the throughs (minimum points). Connecting the peaks (maximum points) gives us the resistance line. Whereas, in case of a downward trend it is the opposite: the support line is drawn by connecting the peaks and the resistance line is drawn by connecting the minimum points. A trend is upward, if the peaks are getting higher and higher. A trend is declining if the throughs are getting lower over time. When the market price goes outside the channel (resistance and support lines) and stays outside by the end of the day, it is called breakout. If the breakthrough does not exceed 2%, it is called a "dead" breakout.


Upward trend line (ascending trend)
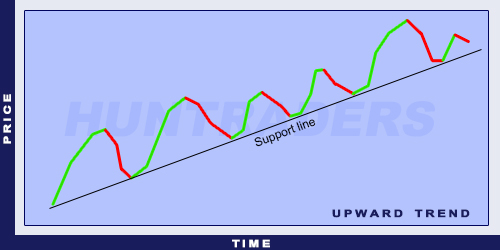
Upward trend line (ascending trend)
- drawn by connecting successive minimums,
- the more minimum points there are, the stronger the trend,
- also called the support line.
Downward trend line (descending trend)
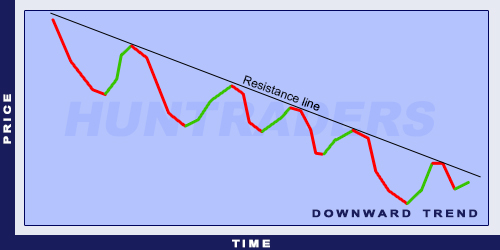
Downward trend line (descending trend)
- drawn by connecting successive minimums,
- the more minimum points there are, the stronger the trend,
- also called the support line.
Horizontal trend line
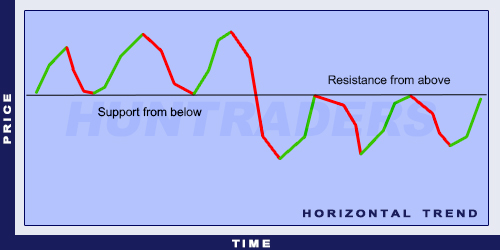
Horizontal trend
- drawn by connecting successive minimums or maximums,
- the more minimums or maximums points there are, the stronger the trend,
- called support line if the market price is above the trendline and called resistance line if the price is below the trendline.