


In most of the cases, prices move in channels. To show the channel line, a straight line is drawn parallel with the trendline, until the minimums and maximums. In case of an upward trend, the channel line acts as the resistance. On the other hand, when a downward trend develops, the channel line will act as the support. When a massive breakout (with large volume) occurs, it is assumed the trend will probably continue. The scale and the direction is highly predictable.
- The scale of the increase/ decrease equals the width of the channel
- The direction of the movement is the opposite of the direction of the breakout


The role of support and resistance lines will be inverted after a breakout in case of a horizontal trend. This phenomenon can be observed for upward and downward trends as well.
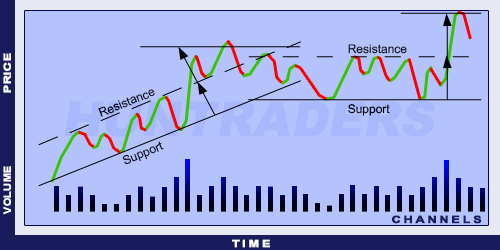
Channels
- Trendline: At least two values are required to draw a trendline. The trendline clearly defines the direction of the trend. It is going to increase for an increasing channel, and will contain at least two minimum values. On the contrary, for a decreasing channel, the trendline will decrease and contain at least two maximum values.
- Channel linel: Channel line is parallel to the trendline. In ideal cases, the channel line is given by two maximum or minimum values. However, there may be cases when only one value is available and the channel needs to be drawn based on the trendline.
- Upward channel: The trend is upwards until the market price moves and increases within the channel. The first sign of a change in a trend is when the market price falls below the support line, outside the channel. The next similar event increases the probability of a trend change. Market prices above the resistance line indicate the acceleration of the trend.
- Downward channel: The trend is downwards until the market price moves and decreases within the channel. The first sign of change in a trend is when the market price rises above the resistance line, outside the channel. The next similar event increases the probability of a trend change. Market prices below the support line indicate the acceleration of the trend.
Some resistance and support lines have greater importance than the others. The more of the following criteria the lines meet the stronger they are:
- The more times the price reaches the channel the more important it is
- The bigger the turnover near the channel line the more important it is
- Newly formed lines are more important
- The wider the channel the more important it is
Technical analysis is hardly ever accurate. Because of that, resistance and support zones are defined instead of lines. The width of the zone is usually 2%. When the closing price is outside the zone, a breakout happens. Movements within the zone are rather interpreted as warnings.
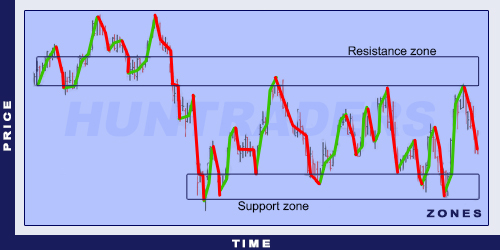
Support and resistance zones