


Description and methodology
Stochastic is an oscillator type indicator. An American analyst, George C. Lane has developed it in the 1950s. The indicator compares the current closing price with the trading price range of the previous interval. When closing prices are close to the previous range’s top values, there is an accumulation (buyer pressure). When closing prices are close to the previous range’s bottom values, there is a distribution (seller pressure). The indicator helps to find conflicting movements between the stochastic line and the price of the instrument. This can help to assess selling or buying decisions. Stochastic analysis is based on the following observations:
- As share prices decrease, closing prices are getting closer to the given period’s absolute minimum points.
- As share prices increase, closing prices are getting closer to the given period’s absolute maximum points.


The calculation is the following:
[latex]\% K=\frac{CurrentClosePrice-LowestMin(n)}{HighestMax(n)-LowestMin(n)}\times 100[/latex]
The n is the number of periods. This parameter influences the indicator’s sensitivity. 14-day period is the most commonly used, just like for the RSI indicator. The %K value shows where is the position of the closing price within the trading range. It is a percentage value, so the oscillator is going to move between 0 and 100. Signal line is the 3-day moving average of the %K.
[latex]\% D=MA(3,\% K)[/latex]
There are three types of Stochastic Oscillators: fast, slow and full. Fast Stochastic analysis uses two oscillating graphs: %K and %D lines. Their goal is to determine the last closing price’s position within the period’s price range. Usually analysts choose 14 days for the analysis. The 14-day %K uses the lowest and highest prices of the analysed 14 days. %K line is calculated the following way:
[latex]\% K=\frac{LastClosePrice-LowestMin(14nap)}{HighestMax(14nap)-LowestMin(14nap)}\times 100[/latex]
where LastClosePrice is the last closing price, LowestMin(14) is the lowest price within the 14 days, and HighestMin(14) is the highest price within the 14 days. The analysed 14 periods can be daily, weekly, or monthly data. The formula measures the last closing price’s position within the period’s price range in a percentage value. Above 80%, the last closing price is close to the top of the range. Below 20%, the last closing price is close to the bottom of the range. The %D is the %K line’s moving average consisting of 3 data. This element is called Fast Stochastic graph. For the Slow Stochastic graph, one need to calculate another moving average of the %D and %K, also consisting of 3 data. Most brokers use the Slow Stochastic indicator, because it signals market processes more reliably.
Let’s compare the Fast and Slow Stochastic Oscillator. For the Slow Stochastic, the formula will show %K(slow) and %D(slow). %K(fast) and %D(fast) are going to be used for the Fast Stochastic indicator. The power of the Stochastic Oscillator is the %K(fast). The two indicators’ biggest difference is the sensitivity. Fast Stochastic reacts to price changes more quickly, giving more false signals than the Slow indicator.
In the example below, Fast Stochastic Oscillator is the top chart. The thick black line is the %K(fast) and the thin red line is the %D(fast). %D(fast) is also called the trigger line of %K(fast). To smoothen out the %K(fast) and to draw the %D(fast), the 3-day SMA of the %K(fast) is used. Slow Stochastic Oscillator is visible at the bottom. The thick black line is the %K(slow) and the thin red line is the %D(slow). To determine the %K(slow), the 3-day SMA of %K(fast) is calculated. This 3-day SMA reacts to market changes more slowly than the %K(fast). %K(slow) is identical to the %D(fast) line. To draw the trigger line or the %D(slow) line, the 3-day SMA of the %K(slow) is calculated.
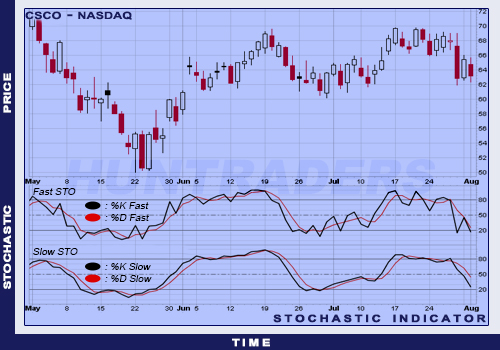
Fast and Slow Stochastic Oscillator
The Full Stochastic Oscillator has 3 parameters. The first is the %K(full)’s number of periods, the second is the %D(full)’s number of periods. The last parameter is a so-called smoothing factor, which helps to determine the %K line. Full Stochastic Oscillator is more flexible and developed than the Slow and Fast types. For example, a (14, 3) Fast Stochastic equals the (14, 1, 3) Full Stochastic or a (12, 2) Slow Stochastic equals the (12, 3, 2) Full Stochastic.
%K and %D are calculated the following way:
[latex]\% K(fast)=\% K(x(period))[/latex]
[latex]\% D(fast)=SMA(y,\% K(fast))[/latex]
[latex]\% K(slow)=SMA(3,\% K(fast))[/latex]
[latex]\% D(slow)=SMA(y,\% K(slow))[/latex]
[latex]\% K(full)=SMA(y,\% K(fast))[/latex]
[latex]\% D(full)=SMA(z,\% K(full))[/latex]
The first parameter is x, the second parameter is y (in days), and the third parameter is z (in days, only present in the Full Stochastic calculation). The x is usually 14, the y is usually 3 for the Fast and Slow Stochastic Oscillators.
Trading signals
The most meaningful sign is if %D moves in the opposite direction of the share price when %D is in the oversold or overbought range. Decreasing prices can be expected when %D is above 80% and draws two decreasing peaks while market prices are increasing. Increasing prices can be expected when %D is below 20% and draws two increasing troughs while market prices are decreasing. Sell or buy signals are at the %K and %D lines’ crosses.
Use
Values above 80 indicate oversold, values below 20 indicate overbought markets. However, the share can continue increasing even after the indicator has reached 80 or continue decreasing even after the indicator has fallen to 20. It can be a buying signal when the oscillator falls below 20 and the Stochastic curve crosses it from below. It can be a selling signal when the oscillator rises above 80 and the Stochastic curve crosses it from above.
Buying signal is when %K rises above %D and selling signal is when %D rises above %K. The most reliable signals are the divergences formed on oversold and overbought levels. Selling signal is when the oscillator is in the overbought level, a negative divergence has formed, then sank below the 80-line. Buying signal is when the oscillator is in the oversold level, a positive divergence has formed, then rose above the 20-line.
- Trading on a sideways market: Values above 80 indicate oversold, values below 20 indicate overbought markets. These signals are reliable even on trendless markets.
- Trading on a trending market: Positions should only be opened in the current trend’s direction.
Examples
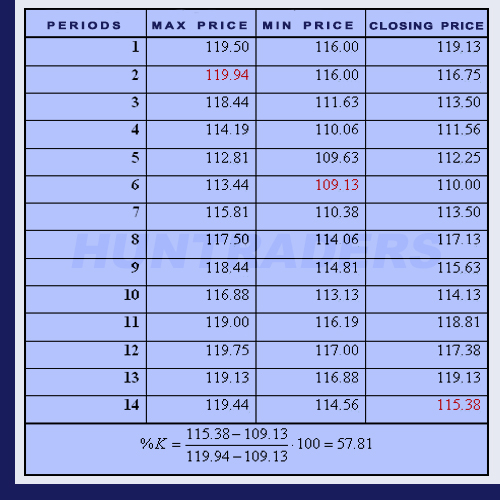
Data for the Stochastic Oscillator example
The %K value shows where is the position of the closing price (115.38) within the trading range. The result is in a percentage form. Stochastic Oscillator is a value between 0 and 100. 0 means that the last closing price was the lowest in the examined period. 100 means that the last closing price was the highest in the examined period.
The overbought and oversold crosses gave false signals in the example below. Simply, there were too many %K(slow) and %D(slow) intersections. When paying attention to the divergences as well, the Oscillator gives less and more reliable signals. Slow Stochastic gave 2 signals between August 1999 and March 2000. There was a buying signal in November 1999 (positive divergence followed by a 20-line cross). The double peak in November and December was not a divergence. There was a selling signal in January 2000 (negative divergence followed by an 80-line cross).
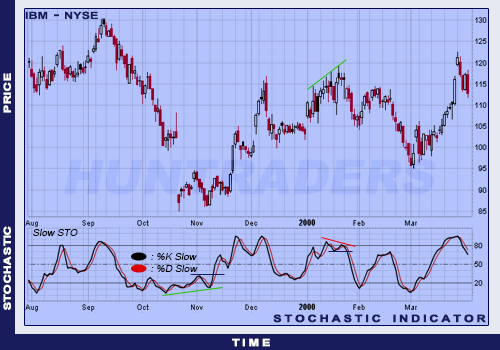
Selling and buying signals on the Stochastic Oscillator