


Desription and methodology
The On Balance Volume (OBV) indicator was introduced by Joe Granville in his book published in 1963. It was the first and most well-known indicator which could measure positive and negative money flow. The principle of the indicator states that the change in the trading volume precedes the change in share price. Therefore, OBV uses share price and volume data to measure whether the market is characterised by accumulation or distribution. When the share price increases, the OBV value is increased by the volume. When the share price decreases, the OBV value is decreased by the volume. When prices are constant, the value of OBV will remain unchanged. OBV is calculated the following way:
- When Closing price Today > Closing price Yesterday, then OBV = OBV Yesterday + Volume Today
- When Closing price Today < Closing price Yesterday, then OBV = OBV Yesterday - Volume Today
- When Closing price Today = Closing price Yesterday, then OBV = OBV Yesterday
OBV determines the cashflow of an instrument with the help of historical trading volume data. When share price closes higher than yesterday, the trading volume is added to the accumulated OBV value. When share price closes lower than yesterday, the trading volume is subtracted from the accumulated OBV value.


Trading signals
- Confirms the new highs and lows. The trend in strengthened when the indicator and the share price reaches new peaks or troughs. Increasing OBV strengthens the trend when there is an ascending trend. Decreasing OBV weakens the trend when there is a bearish trend. The direction of the OBV is especially important when the share prices are moving within channels. An increasing OBV indicates that the share price will break out from its channel upwards. A decreasing OBV indicates that the share price will break out from its channel downwards.
- Forecasts possible trend reversals. When OBV does not follow the new peaks/troughs of the market price, the trend might be about to change. When there is a positive divergence between the share prices and the OBV, a positive change should be expected. In case of a negative divergence, the market has peaked.
- Generates sell and buy signals. Sell or buy signal is generated when the indicator crosses a resistance or a support line and reaches a new peak/trough before the share price changes.
Use
It is recommended to use OBV along with other indicators. Large fluctuations can be smoothed out by using a moving average. When OBV crosses the MA from below, it indicates a possible positive change. When OBV crosses the MA from above, it indicates a possible negative change. The direction of the OBV is more important and indicative than its value. Investors should look for trends on the OBV indicator which are related to the share price.
Examples
The calculation of the OBV is simple. When share price closes higher than yesterday, the trading volume is added to the average. When share price closes lower than yesterday, the trading volume is subtracted from the average. The basis of the OBV is the positive or negative difference between two consecutive days (or maybe weeks, months). How can OBV be used? The purpose of the indicator is to verify whether there is a trend on the market. Just like other Money Flow indicators, the covariance of OBV indicates the likeliness of the trend’s continuation and divergence means the trend’s weakening. Moving average is usually used along with OBV. Their intersection upwards is a positive sign, downwards a negative sign. The following two examples are going to demonstrate trend following and a divergence. CDC has supported the trend, even when the trendline was temporarily broken.
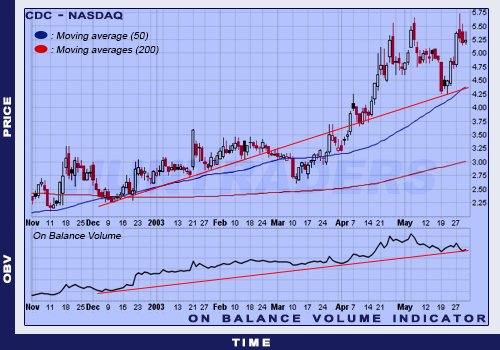
OBV indicator’s trend confirmation
Home Depot share is a good example for a positive divergence. When the share price formed a double button, the OBV was increasing. Furthermore, at a local trough, the indicator was lower than the following minimum points.
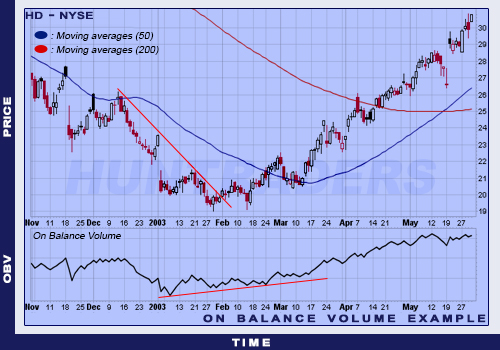
OBV indicator’s positive divergence
In the following illustration, OBV is used to confirm the trend. After the peak in September, the share price started to decrease. This movement was in harmony with the decreasing trading volume. This indicates the continuation of a bearish trend.

OBV indicator’s trend confirmation