


Description and methodology
Moving averages are the easiest to implement. It smoothens out price fluctuations and makes it easier to recognise trends. Many indicators are based on moving averages. The calculation is based on past data. MAs change in parallel with the share prices. First the share or index changes and then the MA. Therefore, MAs always show something that already happened. They are trend-following indicators, because they are based on past data. All historical data are treated equally, more recent data do not get larger significance. When a share is in a trend phase, MAs give good signals. However, when there is no trend and the market is sideways, moving averages can give false signals.


Moving Averages can be calculated for opening, closing, maximum or minimum prices. The moving average of moving averages is used commonly.
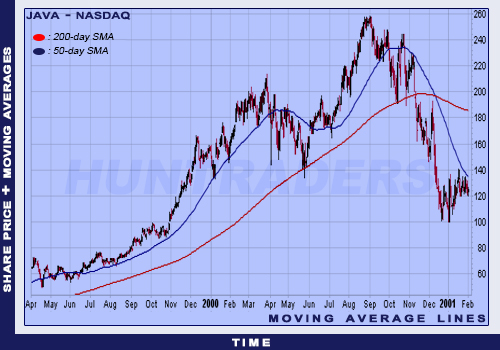
200- and 50-day SMA moving averages
There are three main types of moving averages:
- Simple Moving Average (SMA): indicates a simple average of the historical data. SMAs usually use closing prices, but opening, minimum, or maximum prices can be used as well. The formula is the following:
[latex]SMA(j)=\frac{\sum_{i=j-N}^{j}Value}{N}[/latex]
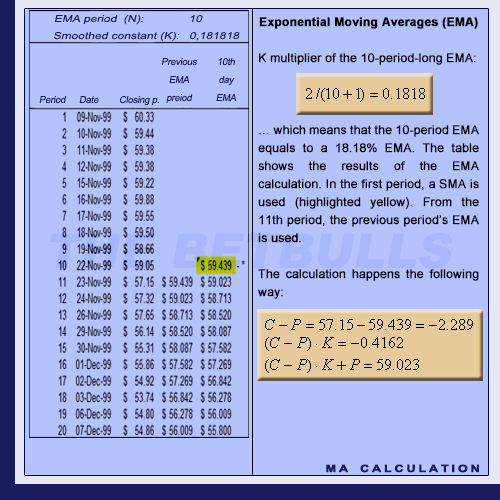
- Exponential Moving Average (EMA): used to avoid the lagging of the SMA. Recent data get larger weights and old data get smaller weights in the calculation. Then the data is summed and divided by the sum of the weights. EMA is more sensitive to new data and shows trend reversals more rapidly. A 10-day EMA weights maximum 18.18% of the new data and a 20-day EMA weights maximum 9.52% of the new data. EMA has more weights on new data than the SMA. EMA can be percentage-based or period-based. The parameter of the percentage-based EMA is a percentage. The parameter of the period-based EMA represents the time horizon of the EMA. The formula of EMA is the following:
[latex]EMA(current)=\left \lfloor Price(current)-Ema(previous) \right \rfloor\times Multiplier+EMA(previous)[/latex]
for the percentage-based EMA, the multiplier equals the percentage of the EMA. For the period-based EMA, the multiplier is 2 / (1 + N), where N is the number of periods. In theory, all previous closing prices are used to calculate EMA. The influence of older data decreases over time, but never ceases to exist.
- Weighted Moving Average (WMA): the recent data is treated with larger significance. The data are multiplied with weights set by the trader and the result is summed and divided by the sum of the weights. WMA is more sensitive to new data and shows trend reversals more rapidly.
[latex]WMA=\frac{\sum j\times C_{j}}{\sum_{j=1...N}^{j}}[/latex]
The difference between the different MAs is the weighting. There are no weights for SMA, while EMA and WMA gives larger weights to more recent data.
Trading signals
One may believe that quicker signals and more sensitivity is more indicative. This is not always the case, because sensitive moving averages are less reliable. The more sensitive an indicator the more signals it gives. The increased sensitivity increases the number of false signals. Less sensitivity produces less but more reliable signals. Although, the signals may appear too late. The problem with moving averages is similar. Shorter MAs are more sensitive and give more signals. EMA generates more signals than the SMA, because it is more sensitive. However, the increased sensitivity increases the number of false signals. Longer moving averages move more slowly and give less signals. These signals are more reliable, but are generated late. All investors must gain experience in using MAs to find the correct trade-off between sensitivity and reliability.
- Using one MA. Longer (50- or 20-day) MAs are giving the trading signals. Because of the time horizon, the MA line’s breakouts give the signals instead of the crosses. A short-term (3-day) and a medium-term (21-day) MAs’ crossover can give signals. Two short-term (3- and 8-day) and a medium-term (21-day) MAs’ crossover can give signals if both short-term MAs cross the medium-term MA. Sometimes only one of the short-term MAs crosses the third MA. This way the false signals are filtered out more easily.
- Using two MAs. The crossover of one short (fast) and one long (slow) MA is used to recognise buy and sell signals. Buy signal is when the fast MA crosses the slow MA from below. Sell signal is when the fast MA crosses the slow MA from above.
Use
The choice of MAs depends on the share, the trading style and on the overall strategy. SMA is slower and EMA is able to generate fast changes. Several investors use EMA in short-term to be able to react on price changes quickly. Other investors prefer SMA to recognise long-term trends on the market. MAs also depend on the examined shares. A 50-day SMA may give better signals on the NASDAQ market and a 100-day EMA may give better signals on the NYSE market. The type and time horizon of moving averages depend on the share and its past performance.
MAs smoothen out the share price changes and make it easier to recognise the direction of the trend. They react on changes late, because they are based on past data. MAs cannot forecast trend reversals, they are rather following current trends. Thus, they are rather used to identify and follow trends than forecasting. They are not effective on sideways markets. Therefore, traders should find shares with trends before making decisions based on MAs.
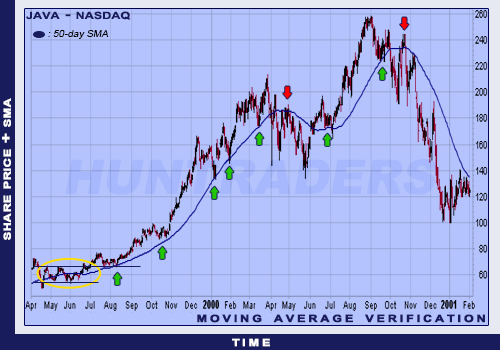
Usually three things can happen with share prices: be in an ascending trend, be in an inclining trend, or move sideways. Ascending trend is when the maximum and minimum points are increasing over time. Inclining trend is when the maximum and minimum points are decreasing over time. Sideways market is when there is no trend (nor ascending nor inclining). When the share price is sideways, an ascending trend starts when the share price crosses the channel’s top line. An inclining trend starts when the share price crosses the channel’s bottom line.
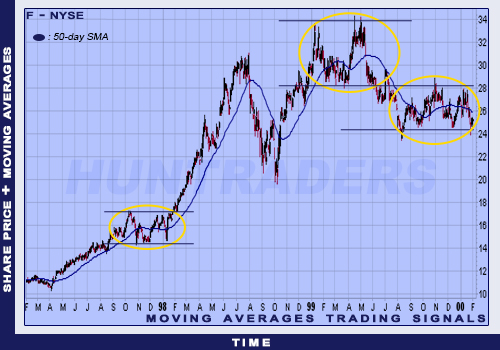
Trading signals of Moving Averages
The chart above is a good example how the share price can be in a trend and a sideways state in the same time. The market periods are the sideways share prices. It is difficult to tell when a trend changes to a sideways movement or when a sideways movement changes to a trend. In case of an ascending trend, the MA is below the share price. In case of an inclining trend, the MA is above the share price. The example used a 50-day MA.
When the right shares have been chosen, the next thing to do is to determine the type of the MA and its time horizon. The number of periods can be different from its volatility, according to its trending characteristics. The more a share changes, the more customisation it requires and the longer MA is recommended to be used. Trendless shares also require longer MAs. There is no predetermined parameter for the period. 21, 50, 89, 150, 200 days and 10, 30, 40 weeks are the most commonly used. Short-term traders think in 2-3 weeks and use 21-day MAs. Longer-term traders think in 3-4 months and use 40-week MAs. Professionals recommend the following intervals:
- short term: 5-20 days,
- medium term: 21-84 days,
- long term: 84-200 days (13-40 weeks),
Which MA should be used? When there are too many breaks in the share price, the length of the MA should be increased to reduce sensitivity. If the MA reacts too slowly to price changes, the length should be decreased to enhance sensitivity. Both the SMA and the EMA should be tried. EMA is usually more effective in short-term due to its sensitivity. SMA is usually more effective in long-term when high sensitivity is not required. MAs are used for the following two purposes:
- Trend identification and verification. To identify the direction of the trend, three factors of moving averages should be observed: direction, position, and intersections. The first step is to examine the direction of the moving average. When the MA is increasing, there is probably an ascending trend. When the MA is decreasing, there is probably an inclining trend. This factor is easily observable on charts.
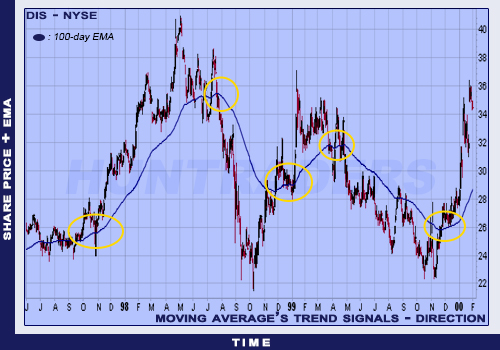
MAs’ trend signals: direction
The second step is to determine the relative position of the share price. Comparing the position of the share price and the MA helps to determine the trend’s direction. When the price is above the MA, there is an ascending trend. When the price is below the MA, there is a downwards trend.
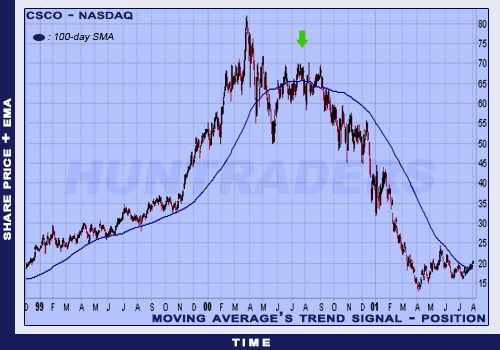
MAs’ trend signals: price
The last technique is to use the combination of a shorter and a longer moving average. When the shorter MA is above the longer MA, there is an ascending trend. When the shorter MA is below the longer MA, there is a downwards trend.
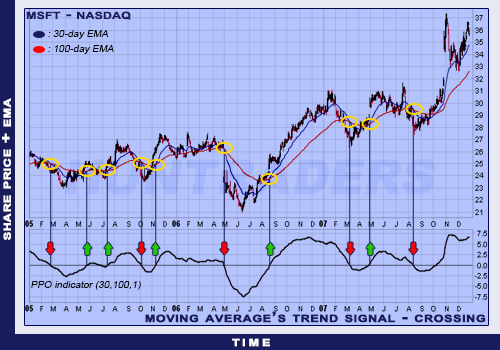
MAs’ trend signals: crosses
- Identify and confirm support and resistance lines. Moving Averages can identify support and resistance lines. The best results of support and resistance line identification are on markets with strong trends.
MA confirmation
Moving Averages can identify trends, support and resistance lines. Beginners may think it is enough to look at the share’s chart to decide whether it is in a trend phase. However, long-term decisions should be always based on MAs. Furthermore, Average Directional Index (ADX) can identify the shares in trend phases. MAs have more advantages than disadvantages. It is a trend-following indicator, so it will always react later to share price changes. This is not necessarily bad. MAs help investors to see whether they are trading in the right direction. Moving Averages are not effective when the shares are in a sideways market phase. If there is already a trend, MAs may signal late the reversal. One should not expect to open a position at the beginning of the trend and close it at the end when using MAs. MA is recommended to be used along with other indicators and analysis tools. MAs should be used to confirm the signals of other indicators.
Examples
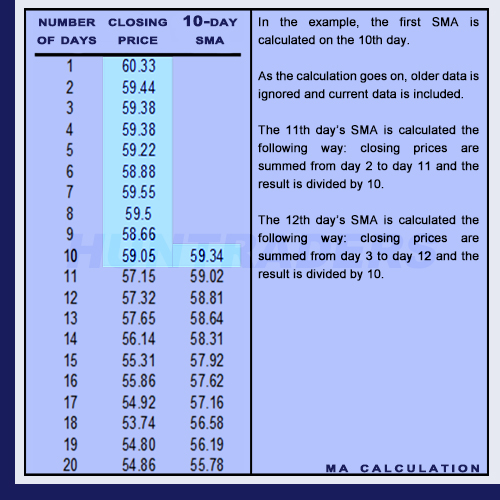
Calculating SMA
The chart below belongs to the table. The SMA starts on the 10th day. The illustration visualises the historical nature of the indicator and makes the lag visible. The example shows an inclining trend, but the 10-day SMA stays above the share price. The price would have to increase to be above the SMA.
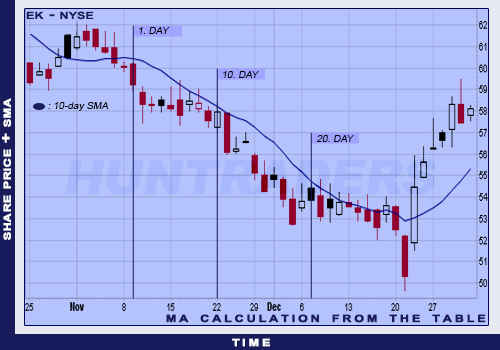
Illustrating the SMA calculation
Calculating EMA
Illustrating the EMA calculation
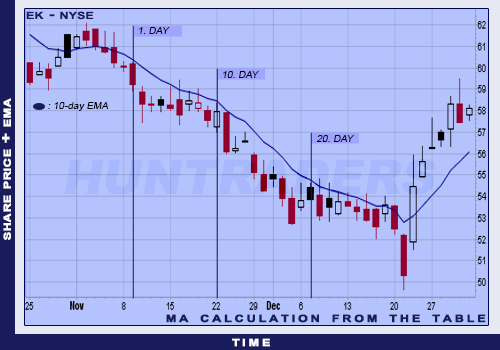
One would expect only little difference between the SMA and the EMA. The example below shows 20 business days, and there is a barely visible difference between the SMA and the EMA. The EMA’s curve is closer to the current prices than the SMA. To be more precise, the EMA is 3/8 closer than the SMA (average value).

Difference between EMA and SMA
Between day 10 and 20, EMA was closer to the price than SMA 8 times out of 11. The absolute value of the difference of the EMA and the price was 1.52. In the case of SMA, this difference was 1.69. When the share started moving sideways, the SMA sank further. In that period, SMA was actually closer to the price. EMA did show the direction of the price, but kept the direction. However, SMA kept on decreasing and almost touched the price on 13. December.
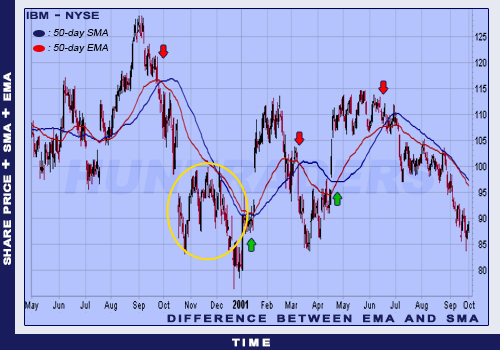
Difference between EMA and SMA
The chart above shows the difference between a 50-day EMA and a 50-day SMA. The arrows show the spots where the share started a strong trend. The SMA reacted the changes more quickly and it was also closer to the share price than the EMA.