


Description and methodology
This indicator was developed by Marc Chaikin. Its calculation is very similar to ACC/DIST’s. ACC/DIST can measure the sell and buy pressure from the relationship of high and low values and the following closing price. There is a pressure on the buyer side when the share price closes in the upper range in a given period. There is a pressure on the seller side when the share price closes in the lower range. ACC/DIST is calculated by multiplying the Closing Location Value (CLV) with the trading volume for each period. CMF only considers the accumulated sum of a given period instead of the whole data population. It usually means 21 days.
[latex]CMF=\frac{\sum n\times Acc/Dist }{\sum n\times Volume}[/latex]
where n is the length of the chosen period. This way the image of the buyer/seller side’s strength is more accurate. However, there is a larger chance for false signals.
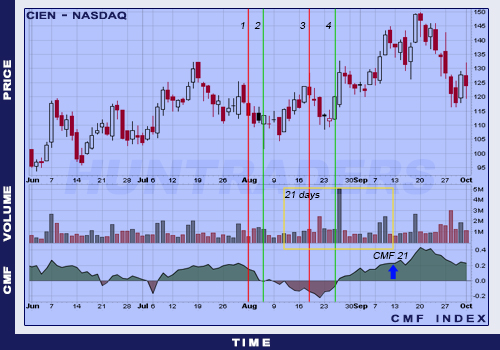
21-day CMF Indicator’s buyer and seller pressure
By changing the number of periods, the indicator can be customised to fit the instrument. The 21-day CMF Indicator can represent the previous month’s seller and buyer pressure. One month is enough to filter out random noises in the results. Using a larger range makes the indicator less sensitive and fast. Weekly charts use shorter periods than monthly charts.


Trading signals
- CMF is bullish when has a positive value (usually above 0.25).
- CMF is bearish when has a negative value (usually below -0.25).
- When CMF value drops below 0 and the share price increases, it might indicate a trend reversal.
- The presence of a divergence can help to use the indicator. But the value of the CMF is more important.
- Accumulation: The CMF Oscillator gives a long signal when the share is in an accumulation state. There are three factors showing the accumulation of a share. The first is the positive or negative value of the CMF. When CMF is positive, there is a buyer pressure and accumulation. The second factor is the time horizon for which the oscillator’s value remains positive. The longer time the CMF stays positive the more accumulation there is on the market. The last factor is the intensity of the oscillator. It is also important to know how the value of the CMF changes. The bigger the positive value of the CMF the larger the buyer pressure and the accumulation. Usually values above 0.10 are reliable signals. Values above 0.25 indicate a strong pressure on the buyer side.
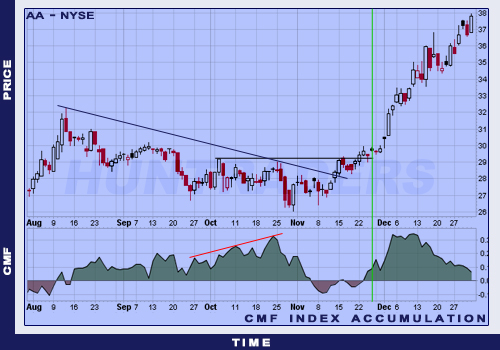
CMF Indicator example for accumulation
- Distribution: The CMF Oscillator gives a short signal when the share is in a distribution state. There are three factors showing the distribution of a share. The first is the positive or negative value of the CMF. When CMF is negative, there is a seller pressure and distribution. The second factor is the time horizon for which the oscillator’s value remains negative. The longer time the CMF stays negative the more distribution there is on the market. The last factor is the intensity of the oscillator. It is also important to know how the value of the CMF changes. The bigger the negative value of the CMF the larger the seller pressure and the distribution. Usually values below -0.10 are reliable signals. Values below -0.25 indicate a strong pressure on the seller side.
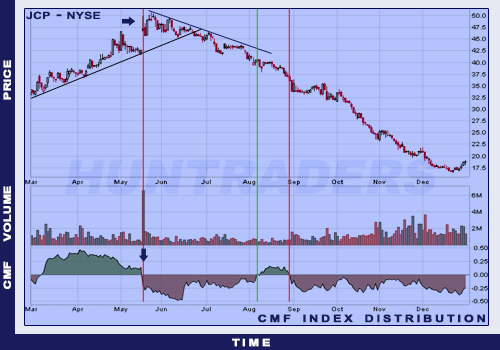
CMF Indicator example for distribution
Use
Complementary indicators are recommended to use. Usually it gives correct signals when used together with Momentum and MACD. These indicators are based on closing prices and react on share price changes. The signals are also correct when Stochastic, CCI or RSI indicators validate them. They are momentum-based and signal overbought and oversold states. One possible combination of indicators can be:
- Chaikin Money Flow: Not a trend-follow indicator, measuring buyer- and seller-side pressure.
- RSI: Momentum indicator, determines the oversold and overbought levels.
- Moving Averages: Trend-follow indicator, shows trends in the share price movements.
- Price Relative: A comparison indicator, helps to compare the share with the index.
CMF can be easily connected with other technical analysis tools. The oscillator is not influenced by daily share price changes. It only considers the closing prices of the examined periods. It is both an advantage and a disadvantage for the indicator. CMF can give false signals, because it cannot follow the changes from one day to the next. It can happen that the indicator moves in the opposite direction of a gap. CMF indicator can be used for daily trading as well. When used weekly or monthly, the CMF values will not be accurate in the first and last period. Chaikin uses a 12-day-long time horizon for the CMF indicator. If the investor wants to use CMF for weekly charts, he should use a shorter time range. The 21-day period can represent the month’s trading accurately. Every share has a specific time horizon.
The short-term trends are less important than the absolute levels. The further the positive value of the CMF from 0, the more bullish the signal. The time spent on the trading signal is also important.
Examples
The use CMF is really similar to the Money Flow indicators’. The only difference is that the CMF value’s positive or negative state is a signal already. Usually this method cannot be used. Except when the state remains unchanged for long time. The confirmation and divergence is more reliable. For the latter, the JCP share’s chart is a good example. The sales volume has decreased at the end of the inclining trend and shortly the purchase volume has increased. It was visible on the continuously increasing CMF level, which indicated this turn. It would have been pointless to act on the CMF signal if the formation does not give the chance for purchasing. CMF should not be used alone.
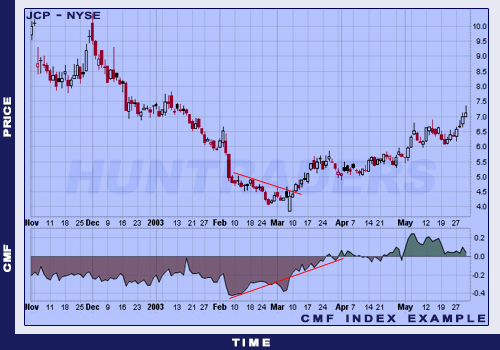
CMF Indicator example for divergence
The following chart shows the SBUX.
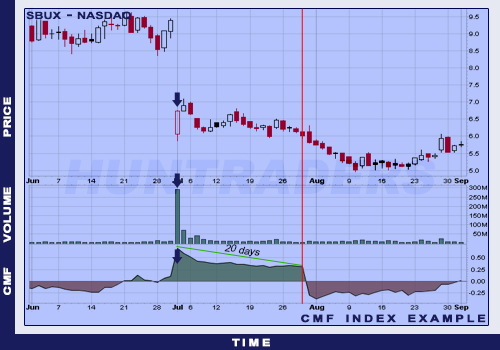
CMF Indicator example