


Description and methodology
The indicator was developed by Larry Williams and he published it in the Technical Analysis of Stocks and Commodities journal in 1985. The ultimate Oscillator is a function displaying share price movements in three different periods. Its scale is from 0 to 100 (50 is the midline). The oversold level is below 30, overbought is above 70. The three time periods are chosen by the trader. Typically, 7 days, 14 days, and 28 days are used. There periods are overlapping, because the 7 and 14 days are included in the 28 days. The calculation is the following:
[latex]BP=TodayClose-TodayTL[/latex]
where BL is the Buying Pressure, TodayTL is the True Low (today’s minimum). Furthermore, TodayTR (True Range) is the biggest of the following values:
[latex]TodayMax-TodayMin,TodayMax-YesterdayClose,YesterdayClose-YesterdayMin[/latex]
Let’s calculate BPSum1, 2, and 3. The different BP values are summed for the different time periods:
[latex]BPSum1=n1PeriodSMA(BP)\times n1[/latex]
[latex]BPSum2=n2PeriodSMA(BP)\times n2[/latex]
[latex]BPSum3=n3PeriodSMA(BP)\times n3[/latex]
Let’s calculate TRSum1, 2, and 3. The different TR values are summed for the different time periods:
[latex]TRSum1=n1periodSMA(TodayTR)[/latex]
[latex]TRSum2=n2periodSMA(TodayTR)[/latex]
[latex]TRSum3=n2periodSMA(TodayTR)[/latex]
Let’s calculate the Raw Ultimate Oscillator:
[latex]RawUO=4\times \frac{BPSum1}{TRSum1}+2\times \frac{BPSum2}{TRSum2}+1\times \frac{BPSum3}{TRSum3}[/latex]
Finally, let’s calculate the Ultimate Oscillator:
[latex]UltimateOscillator=\frac{RawUO}{4+2+1}\times 100[/latex]


Trading signals
Buying signals. The indicator gives buying signals in the following cases:
- Bullish divergence: the share price sinks below the previous low, but the Ultimate Oscillator does not sink below its previous low.
- Bullish divergence: the indicator drops below 30, or increases above the highest value of the last period’s bullish divergence.
Selling signals. The indicator gives selling signals in the following cases:
- Bearish divergence: the share price rises above the previous high, but the Ultimate Oscillator does not increase above its previous high.
- Bullish divergence: the indicator increases above 50, or
- decreases below the lowest value of the last period’s bearish divergence,
- increases above 50, then drops under 45, or
- increases above 70 (sometimes it is worth to wait to drop under 70 again).
Use
Oscillators usually compare the smoothened share price with the historical prices of the same share. The indicator changes accordingly to the chosen periods. That’s why Larry Williams developed the Ultimate Oscillator, which is the weighted average of 3 different oscillators using 3 different periods. These are short-, medium-, and long-term oscillators. The periods are usually set to 7, 14, and 28 days.
The Ultimate Oscillator can be used for daily, weekly, or monthly trading. The oversold and overbought levels do not immediately mean sell or buy signals. When the share is oversold or overbought, the trader should wait for a signal which confirms a reversal. Such signal is when the oscillator rises above or drops below 50. Other indicators can also confirm the upcoming reversal.
Examples
The chart below illustrates a bearish divergence until January 2000. Such extreme values are rare for the Ultimate Oscillator. Midline crosses are frequent.
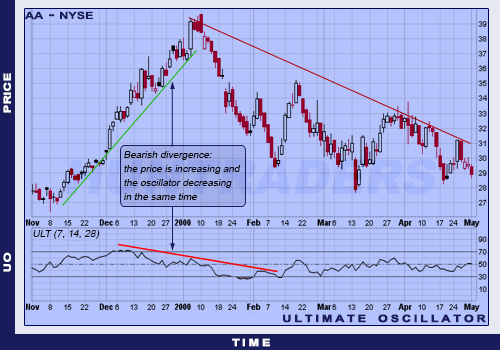
Bearish divergence on the Ultimate Oscillator