


Description and methodology
The indicator was developed by Tushard Chandle and Stanley Kroll in 1994. It measures the RSI level relative to the oscillator trading range in a given period. The indicator is based on RSI values and applies Stochastic formula on that. The result is an oscillator fluctuating between 0 and 1. Chandle and Kroll wrote in their book (The New Technical Trader, 1994) that many trading happen between 80 and 20 RSI values despite the lack of overbought or oversold market state. The aim was to increase the sensitivity of the RSI to recognise oversold and overbought levels. Therefore, they developed the StochRSI. Welles Wilder’s RSI is a momentum oscillator, comparing the number of winner and loser days in a period. George Lane’s Stochastic is a momentum oscillator, comparing the closing prices with the trading range in a period. StochRSI is calculated from the combination of these two momentum oscillators. Applying Stochastic on the RSI gives the StochRSI.
[latex]StochRSI=Stochastic(RSI(price))[/latex]
[latex]StochRSI=\frac{RSI(n)-RSILowestMin(n)}{RSIHighestMax(n)-RSIHighestMin(n)}[/latex]
where n is the number of periods. StochRSI measures the RSI level relative to the oscillator trading range in a given period. When RSI reaches a new minimum in the given period, StochRSI will be 0. When RSI reaches a new maximum in the given period, StochRSI will be 1. A value of 0.2 means that the current RSI is 20% above the lowest level of the current period (or 80% below the highest level). A value of 0.8 means that the current RSI is 80% above the lowest level of the current period (or 20% below the highest level).


Trading signals
- Oversold and overbought crosses. There is a buy signal in an ascending trend, when the StochRSI breaks the oversold level (0.2) from below. There is a sell signal in an inclining trend, when the StochRSI breaks the oversold level (0.8) from above.
- Midline crosses. There is a buy signal, when the StochRSI increases above 0.50 from the oversold level until the values goes below 0.50 again. There is a sell signal, when the StochRSI decreases below 0.50 from the overbought level until the values goes above 0.50 again.
- Negative and positive divergences. There is a buy signal, when the positive divergence on the oversold level is followed by a break of the 0.2 line. There is a sell signal, when the negative divergence on the overbought level is followed by a break of the 0.8 line.
- Strong trend. StochRSI can enter overbought or oversold levels and remain there for several examined periods. A StochRSI above 0.8 indicates that the share is overbought and also a strong ascending trend if the value remains above 0.8 for longer time. A StochRSI below 0.2 indicates that the share is oversold and also a strong inclining trend if the value remains below 0.2 for longer time.
Use
StochRSI is the indicator of an indicator. Therefore, it is more sensitive than the RSI and may give more false signals. It is recommended to use it along with other indicators.
Examples
The chart below shows a strong downwards trend until June 2006. It is a bearish market, because the minimum and maximum points are decreasing. Chandle and Kroll said to open positions only in the market’s direction. The example shows two overbought crosses, signalling to buy stock. There were 4 trading signals from January to May.
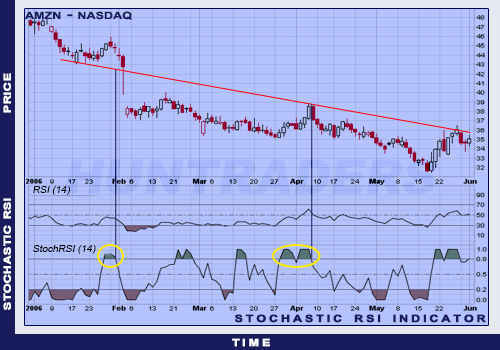
StochRSI showing overbought intersections