


Description and methodology
Money Flow Index (MFI) is a momentum indicator. Its interpretation and calculation is close to the Relative Strength Index (RSI). However, MFI is a more rigid indicator because of the weighted volume. It measures the money flow into/out of the given share more accurately. The indicator compares the positive and the negative money flow with the share price to determine the strength of a trend. MFI is a value between 0 and 100 and is usually used for 14-day periods. Money flow is the result of the share price and the volume. It shows the supply and demand of a share of a given share at a given price. This kind of money flow is not the same as the MFI, but the calculation is similar. The first thing to do when a trader wants to calculate money flow is to determine the average price of the given period. In a 14-day long period, the daily prices should be determined and then a 14-day average can be calculated.
[latex]SimplePrice = \frac{DailyMin + DailyMax + DailyClose}{3}[/latex]
[latex]MoneyFlow=SimplePrice\times Volume[/latex]
MFI compares the ratio of positive and the negative money flow. If today’s price is larger than yesterday’s, the money flow is positive. When using a 14-day long period, all the days should be summed up with positive money flow. MFI is based on the ratio of the positive and the negative money flow (money ratio):
[latex]MoneyRatio=\frac{PositiveMoneyFlow}{NegativeMoneyFlow}[/latex]
Finally, the MFI is calculated by using the money ratio:
[latex]MFI=100-\frac{100}{1+MoneyRatio}[/latex]
The smaller the time horizon, the more rapid the indicator.


Trading signals
- Divergences. Positive or negative divergence between the share and the MFI give sell or buy signals and can forecast a trend reversal. When share prices fall, but there is a positive money flow, then there is a large volume associated with a daily price increase. It is like a weak inclining trend, when the money inflow is bigger than the money outflow.
- Oversold/overbought levels. MFI compares the trading volume with the share price. If the share is overbought, the MFI will be above 80 (bearish market). If the share is oversold, the MFI will be below 20 (bullish market).
Use
MFI’s divergences and overbought/oversold levels give signals to traders.
Examples
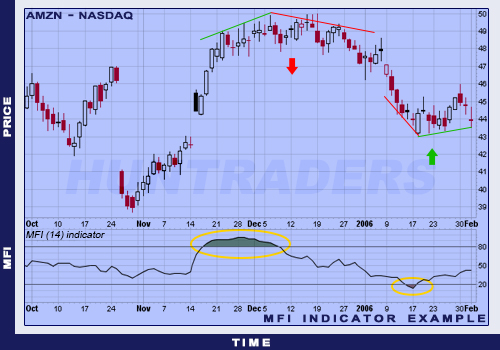
MFI’s divergences and oversold/overbought levels
In the example above, Amazon Inc. has started a strong increase in November 2005. In the beginning of December, there was a small negative divergence between the share price and the MFI, which was followed by a sharp price decrease. MFI in fact, did forecast the trend reversal. When MFI is in a negative trend and the share price is increasing, reversals like the one in December can happen. Divergences between the share price and the MFI can be interpreted only in long term. Therefore, MFI should be used along with other indicators to avoid acting on false signals.

MFI’s divergences and oversold/overbought levels