


Trend
There must be a trend on the market to talk about a trend reversal pattern. The share price enters the pattern from above. It usually develops in 3 to 6 months and signals a reversal in medium- and long-term. The previous trend is usually continued in the pattern. In this case the Wedge is formed after a sudden drop in share price.
- Role: Reversal
- Expected trend: Bullish
- Previous tren: Bearish
- Reliability: Moderate
- Pattern: Wedge
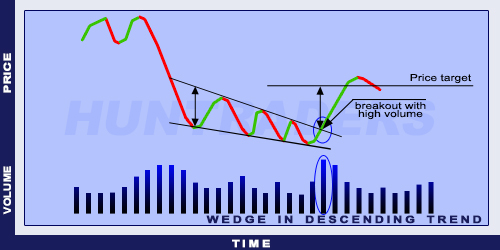
Reversal Wedge in Descending Trend Example
Top resistance line
There must be at least two maximum values to form the top resistance line. These maximums are decreasing over time.


Bottom support line
There must be two minimum values to form the bottom support line. These minimums are decreasing over time.
Narrowing channel
The top resistance and bottom support lines are getting closer over time. The minimum and maximum points are formed in shorter intervals. Minimums are decreasing and have smaller distance between them. This makes the selling pressure decrease and the bottom support line is less dense than the top resistance line.
Breakout
There is no breakout until the share price breaks the resistance line. The narrower the channel, the more probable a breakout. After the breakout, the share price usually goes back to the support line before it starts to increase.
Volume
The decreasing trading volume shows a decreasing supply. The selling activity decreases but the volume remains large within the wedge. The breakout is accompanied by large trading volume.
Target price
The basis is the day with the largest volume at the beginning of the wedge. The width of the wedge on that day is set on the breakout point.