


Trend
There must be a trend on the market to talk about a trend continuation pattern. Pennant patterns usually have sudden price fluctuations or trading volume decrease. Share price form a triangle pattern when a pennant is formed.
- Role: Continuation
- Expected trend: Bullish
- Previous tren: Bullish
- Reliability: Moderate
- Pattern: Pennant
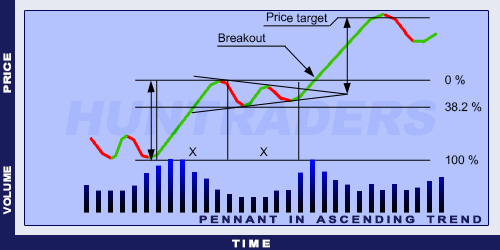
Pennant in Ascending Trend Example
Pole
The pole is from the beginning of the trend until the maximum of the pennant. The trading volume is especially high at the formation of the pole. The pennant and the pole must take the same amount of time to develop.


Pennant
Pennant is a short, triangle-shaped formation, in which the share price moves in a channel. The channel’s direction is the opposite of the trend’s direction. If the trend was ascending, the channel will be increasing (and vice versa). Pennants usually don’t last long. The trading volume is low during the pattern. The correction cannot exceed 38.2% of the pole.
Duration
Pennants are usually formed in 1-12 weeks. Some analysts believe 8 weeks are also enough for this pattern to develop. Ideally, they develop in 1 to 4 weeks. If the pattern exceeds 12 weeks, it becomes a triangle pattern.
Breakout
In an ascending trend, the resistance line must be broken to signal the previous trend’s continuation.
Volume
The pennant’s pole develops when the trading volume is large. The large trading volume comes with a share price increase. The volume increases after the breakout and during the trend’s continuation.
Target price
Target price is determined as the pole’s height set on the support and resistance lines. In case of an ascending trend, the pole’s height should be set on the line drawn at the bottom of the correction level.