


Prior trend
The trend on the market before a Head and Shoulders Top is ascending. It cannot be a Head and Shoulders if this criterion is not met.
- Role: Reversal
- Expected trend: Bearish
- Previous tren: Bullish
- Reliability: Moderate
- Pattern: Head and Shoulders
Head and Shoulders Top Example
Left Shoulder
The first peak in the ascending trend is the left shoulder of the pattern. After the Left Shoulder, the share price starts to fall. The through is usually stays above the ascending trendline, so the trend is not broken.


Head
After the Left Shoulder, the share price starts increasing strongly. It forms a wave and its peak is going to be the maximum of the current trend. The peak is the head of the Head and Shoulders formation. After the peak the share price decreases and breaks the actual trendline.
Right Shoulder
The Head is followed by a strong correction, which forms the minimum point of the right shoulder. This point acts as a support. The share price increase cannot exceed the price level of the head. This lower peak is the right shoulder. The peak of the right shoulder is similar to the left shoulder’s peak. The formation is symmetric, but this is not necessary. It might happen that more shoulders appear or the neckline is skewed.
Neckline
Neckline is drawn by connecting the two troughs. The first point is the end of the left shoulder and the beginning of the head. The second point is the end of the head and the beginning of the right shoulder. Depending on the relative position of the two points, the neckline can be increasing, decreasing or horizontal. The inclination of the neckline determines the power of the pattern: a decreasing neckline means a stronger trend reversal than an increasing trendline.
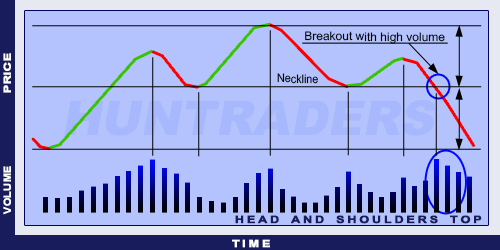
Volume
Volume is an important factor in the Head and Shoulders pattern. The volume can be measured with indicators (OBV, CMF) or simply with the observation of volume levels. Ideally, the trading volume is higher during the left shoulder than during the head. The combination of the decreasing volume and the new maximum signal the trend reversal. The next signal is the high volume at the peak of the head. The final confirmation is the high volume during the right shoulder.
Breaking the neckline
The Head and Shoulders pattern is only complete when the share price breaks the neckline. This happens with a large trading volume.
Resistance from support
As soon as the price broke the support line, the neckline acts as a resistance line. Sometimes the price returns to this level which provides opportunity to close long positions.
Target price
After the share price broke the neckline, the next price target is the distance between the head and the neckline put on the breakpoint. The distance should be put on the point vertically. When the neckline is not horizontal, the determination of the distance does not change.