


Trend
There must be a trend on the market to talk about a trend continuation pattern. The length and duration of the trend is not important, because the triangle is an ascending pattern. The shape is the only important factor in this case. The share price enters the pattern from below.
- Role: Continuation
- Expected trend: Bullish
- Previous tren: Bullish
- Reliability: High
- Pattern: Triangle
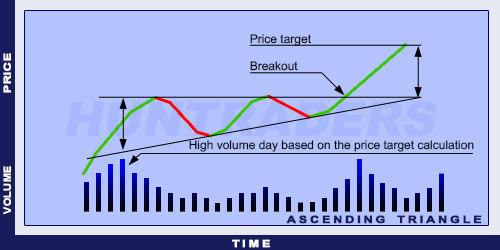
Continuation Ascending Triangle Example
Top horizontal line
There must be two maximum values to form the top horizontal line. These maximum points are not necessarily in line, but they must move within a given range. A certain distance must be between the maximum and minimum values.


Bottom trendline
There must be two minimum values to form the bottom trendline. These minimums are increasing over time and they have a given distance between them. If the next wave’s minimum points are in the same height or below the previous ones, the pattern cannot be an ascending triangle.
Duration
The duration can last from a few weeks to a few months.
Volume
The trading volume decreases as the pattern develops. There can be an upper breakout only if there is a high volume. The volume increases at the maximum points and decreases at the minimum points. A volume-based confirmation is not necessary, but highly recommended.
Pullback to the breakout
According to the technical analysis principles, the support line changes into resistance line and resistance line changes into support line. When the price breaks the top horizontal line of the triangle, it will act like a support. Sometimes the share price returns to this line before it would start increasing.
Target price
The basis of the target price calculation is the group of days with large trading volume at the beginning of the pattern.