


Description and methodology
This indicator was developed by Larry Williams. Williams %R (or %R) is a momentum indicator. It is quite similar to the Stochastic Oscillator. It is mainly used to measure oversold and overbought levels. It is a value between 0 and -100. 0 to -20 means overbought and -80 to -100 means oversold share. %R reflects the relationship of the closing price relative to a trading range in a given period:
- the closer the closing price to the top of the trading range, the closer the indicator’s value to 0
- the closer the closing price to the bottom of the trading range, the closer the indicator’s value to -100
- When the closing price equals to the top of the trading range, the indicator’s value is 0
- When the closing price equals to the bottom of the trading range, the indicator’s value is -100
The calculation is the following:
[latex]\%R=\frac{HighestMax-ClosePrice}{HighestMax-LowestMin}\times \left (-100 \right )[/latex]
Usually a 14-day period is used, but the indicator can be used with daily, weekly, or monthly data.


Trading signals
- Opening short or long position. One should keep an eye on the oversold levels in ascending trends, and open long position. In inclining trends, the overbought levels must be checked and short position should be opened.
- Sell and buy signals. Buy signal is at bullish divergences, when the share price decreases and the oscillator’s minimum points increase. The first minimum point must be below 50. Buying point is when the oscillator increases above the earlier maximum point of the bullish divergence. Sell signal is at bearish divergences, when the share price increases and the oscillator’s maximum points decrease. The first maximum point must be above 50. Selling point is when the oscillator decreases below the earlier minimum point of the bearish divergence.
- Closing short or long position. Long positions should be closed when the indicator signals “sell” or reaches 70 or drops from 50 below 45. Short positions should be closed when the indicator signals “buy” or drops to 30 or jumps from 50 above 55.
Use
Overbought and oversold levels do not immediately mean sell and buy signals. When the share is oversold or overbought, the trader should wait for a signal which confirms a reversal. One way is to wait until the oscillator crosses the midline. Other way is when other indicators confirm the upcoming reversal. One should react to the %R indicator’s signals when it is in the same direction as the trend. Oscillators with shorter scope than the instrument’s cycle can react too early to price changes, signalling too soon the overbought/oversold level of the market and divergences. On the other hand, when the scope is longer than the instrument’s cycle, the oscillator will react too late to the changes. To solve this issue, the indicator uses three different observation periods.
Examples
The example below shows that the 14-day %R has large fluctuations and the tendency to give false signals. The 28-day %R is smoother and gives good signals with higher probability. When the 28-day %R moves in the range of oversold or overbought levels, it signals the continuation of the trend. Its midline intersections gave a few correct signals to open new positions.
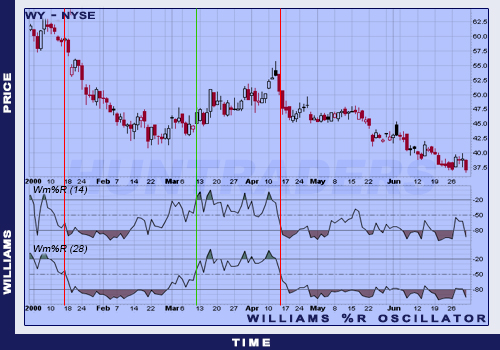
Williams %R indicator example for overbought and oversold levels