


Description and methodology
TRIX is a momentum indicator, showing the three-times smoothened moving average of the percentage change in closing prices. Jack Huston has developed it in the beginning of the 1980s. TRIX oscillates around the zero-line and helps to filter out price movements irrelevant to the current trend. The number of periods is chosen by the user (usually 15). With the help of that, a MA is established. Periods shorter than the period will be sorted out. This indicator is recommended for long-term investors, because it rarely gives signals. It should be used for at least medium-term investments. Its divergences can predict trend reversals with high accuracy. To calculate the TRIX, the period must be chosen for the closing prices’ EMA. The calculation is the following:
- first, the MA of the chosen period is calculated,
- second, the MA is exponentially averaged with the same period,
- third, the previous result is again averaged,
- fourth, the percentage move is calculated.
A Signal line is also required. Usually it is the EMA of 9 periods. The Signal line is calculated the following way:
[latex]M=EMAve(EMAve(EMAve(price)))[/latex]
[latex]TRIX=100\times \frac{M-M(previous)}{M}[/latex]


Trading signals
- Signal line must consist of fewer periods (usually 9). The crosses of the TRIX and the Signal line are giving the trading signals. The intersections do not mean that the current closing prices are much larger/lower (because the Signal’s period is shorter). It is a buy signal when TRIX crosses the Signal line from below. Buy signal is when TRIX crosses the Signal line from above.
- A positive TRIX means steadily increasing closing prices. Ascending trends in the TRIX are buying signals (crossing the zero-line from below). It is a sell signal when the zero-line is crossed from above.
Use
TRIX is not effective on sideways markets and may give false signals. For shorter-term investments, a 12-day (sometimes 15-day) TRIX with a 9-day SMA is recommended. For longer-term investments, a 30-day TRIX with a 9-day SMA is recommended.
Examples
The example below shows three buy signals coming from Signal line intersections. All the signals were followed by an ascending trend. The intersections are great points to open new positions, indicating a rapidly increasing demand on the market.
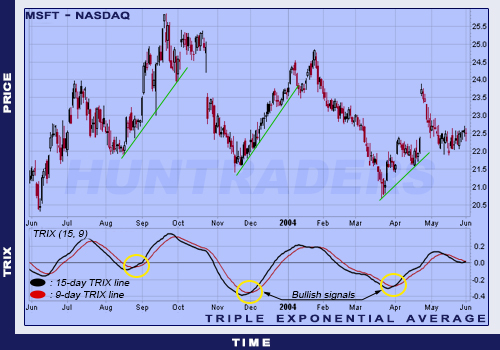
TRIX buying signals example