


Description and methodology
Standard Deviation is a basic statistical measurement, which can give signals related to volatility. Standard Deviation it is the square root of the Variance, which is the average of the squared differences from the Mean. The bigger the difference between the closing price and the mean of the closing prices, the larger the SD and the volatility. In other words, the smaller the difference between the closing price and the mean of the closing prices, the smaller the SD and the volatility. SD is not only good to compare different populations of data, but also to analyse one given population. The calculation is the following in case of an n-size population:
- Calculate the variance. It is the sum of the difference between each data point relative to the mean on the power of 2, divided by n.
- Then calculate the square root of the variance.
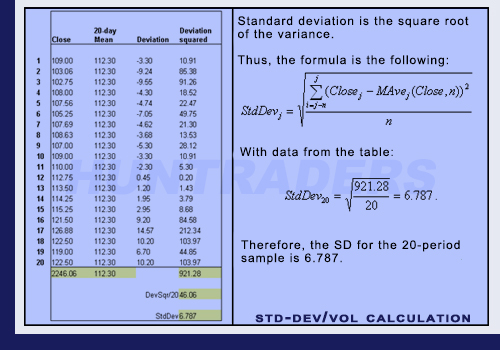
Calculation of Standard Deviation / Volatility
The SD determined the deviation between the upper and lower Bollinger Lines. Therefore, the Bollinger Band Width can replace the Standard Deviation indicator. SD is exactly the half of the Bollinger Band.


Examples
The example below shows how the SD decreased after a lengthy consolidation period. At the end of December, the trading took place in a narrow price range. In this period, volatility has decreased. Around mid-March, the same happened again. However, by the end of March, the volatility has excessively increased. There is a statement for the option market: the higher the volatility of the share, the higher the option premium (the lower the volatility, the lower the option premium).
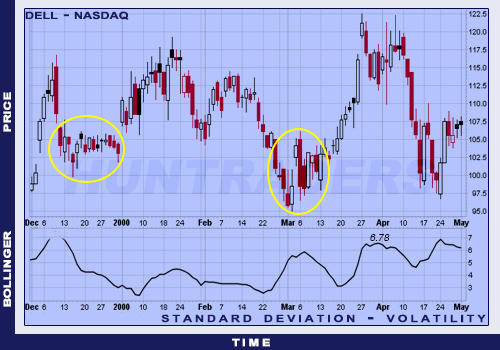
Example for high and low volatility
Volatility
Volatility measures the possible lower and upper limit of the price change with a certain probability on a yearly basis. It helps to determine Stop Loss levels, because it shows what value the share price cannot decrease below or increase above (with a certain probability). Furthermore, it also signals trend reversals. If there is a trend on the market and there is a high volatility, a strong decrease in the volatility would signal the end of the trend. When prices are moving sideways and the volatility is low, a strong increase in the volatility would signal the beginning of a trend. The trend reversal must be verified by the price change (e.g. the closing price breaking an important support or resistance line level).
The calculation is the following:
[latex]Volat(j)=\sqrt{k\times SMA_{j}\left (( X(j)-SMA_{j}(X,N) \right )^{2},N-1)}[/latex]
where
[latex]X_{i}=ln\frac{ClosePrice(i)}{ClosePrice(i-1)}[/latex]