


Description and methodology
Rate of Change (ROC) is a simple but powerful momentum oscillator. It shows the scale of share price changes in a given time period. ROC compares the current price with a price “n” periods before the current price:
[latex]ROC=\frac{TodayClosing-\left ( n \right )PeriodClosingPrice}{\left ( n \right )PeriodClosingPrice}\times 100[/latex]
It is similar to the Momentum, but there are differences in the calculation. The ROC divides the current price with the historical price and multiplies the result by 100. Oscillators fluctuate above and below the zero-line. Thus, ROC moves in both positive and negative ranges.


Trading signals
ROC measures the change in the momentum of the market in a given period. ROC can only indicate the trend’s weakening but not the change in the trend’s direction. A direction change should be observed from other signals.
- Signals the overbought and oversold market. Overbought or oversold market is when the share prices increase or decrease too rapidly within a short period of time and a correction can be expected. When ROC is much above 100, the market is probably overbought. When ROC is much below 100, the market is probably oversold. Overbought and oversold signals are the most reliable when there are no trend-like movements on the market (peaks and troughs are formed in similar levels through longer period of time).
- Signals bullish and bearish divergence. The divergence between the share price and the indicator means the weakening of an ascending or an inclining trend. Bearish divergence is when the share price reaches higher highs, while the Momentum’s peaks are decreasing. This means the weakening of the ascending trend. Bearish divergence is when the share price sinks to lower lows, while the Momentum’s troughs are increasing. This means the weakening of the inclining trend.
Use
The Oscillator is used similarly to the other momentum indicators: signals are given by new peaks/troughs, positive/negative divergences, and midline crosses. ROC is also recommended to be used along with other indicators and analysis tools.
Examples
ROC showed negative divergence at the end of February 2005 and at the beginning of April 2005. It had a negative value before the big falls in share prices.
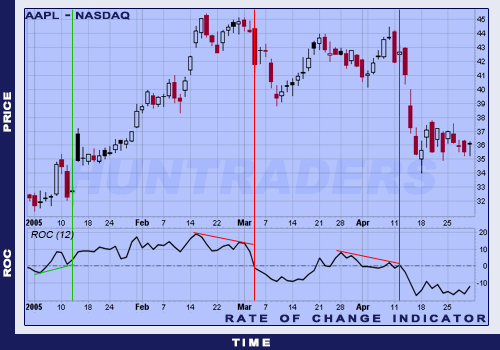
Negative divergences of ROC on the Apple share chart