


Desription and methodology
The basis of the PPO is two exponential moving average. Their percent or absolute difference gives the data for the indicator. The time frame depends on the trader. For daily data, the use of a longer MA is recommended. For weekly data, the use of a shorter MA is recommended. There are two types of oscillators:
- Percentage Price Oscillator (PPO), which has a percentage value. PPO is the shorter MA minus the longer MA and this result divided by the longer MA. The formula is the following:
[latex]PPO=\frac{EMA(10day)-EMA(30day)}{EMA(30day)}[/latex]
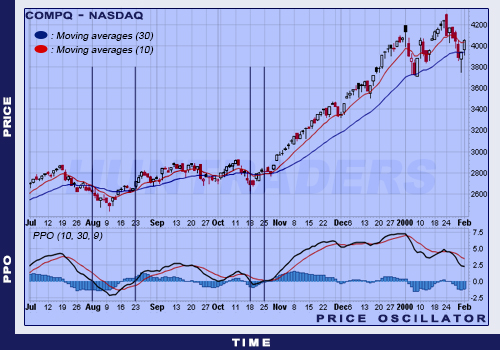
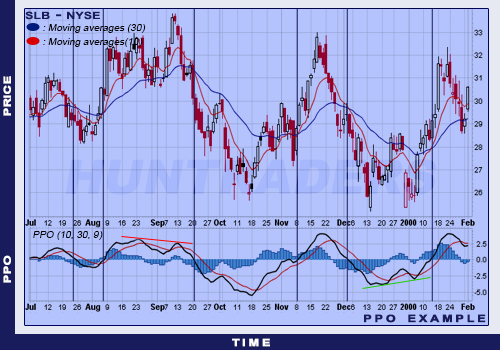
Price Oscillator example
When the PPO curve is calculated, an EMA is drawn upon the PPO (9-day EMA by default). This smoothens out the movements and can give trading signals.
- Absolute Price Oscillator (APO), which is calculated from absolute differences. APO is the shorter MA minus the longer MA. The formula is the following:
[latex]APO=EMA(10day)-EMA(30day)[/latex]
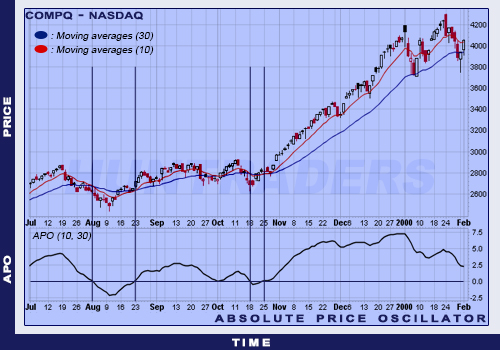
Absolute Price Oscillator example
The result is an oscillator fluctuating around 0, indicating the difference between MAs. It is positive when the shorter MA is larger than the longer MA. It is negative when the shorter MA is the smaller. MACD calculation contains the APO, because MACD is the exponential moving average of the APO.


Trading signals
PPO and APO can give several signals. Their shapes are very similar. All midline crosses are the crosses of the two moving averages. However, the two oscillators’ sensitivity is different, because PPO uses percentages. These differences are clear on the following chart.
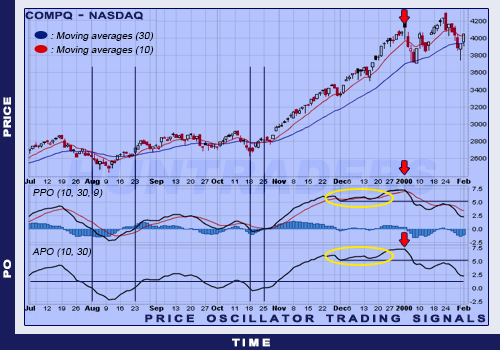
Trading signals of the PPO and APO indicators
PPO Histogram is really similar to MACD Histogram. PPO Histogram is the difference of PPO and PPO 9-day EMA values. The Histogram fluctuates around the zero-line, where the midline crosses and the divergences are easily recognised. The aspects are the same as it was for the MACD Histogram. PPO Histogram midline crosses indicate the crosses of PPO’s moving averages. PPO Histogram is positive when the PPO is larger than its 9-day EMA. PPO Histogram is negative when the PPO is smaller than its 9-day EMA.
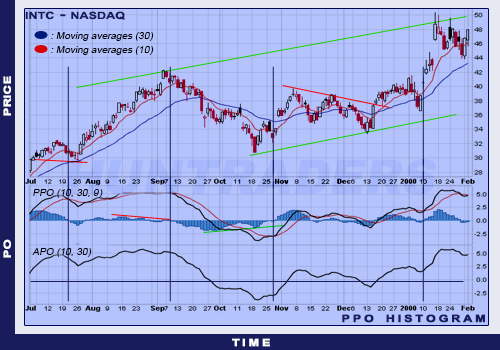
PPO Histogram
PPO Histogram also shows when difference between PPO and PPO 9-day EMA widens or narrows. A fast increase on the histogram means that the PPO increases more rapidly than the 9-day EMA (bullish market). A fast decrease on the histogram means that the PPO decreases more rapidly than the 9-day EMA (bearish market).
Use
Two main advantages of the PPO are the following:
- There is a chance to compare several shares’ Price Oscillator levels. When PPO is +5%, the shorter MA is 5% larger than the longer MA. The values can be compared as percentages, regardless the actual share prices.
- PPO Oscillator represents better the relative position of the two moving averages. The difference between the two MAs is divided by the shorter MA. This way the share prices do not matter and the different periods can be compared easily. However, when using the APO oscillator, the higher the price the larger the APO.
Examples
Negative and positive divergences of the PPO indicator