


Description and methodology
This indicator was developed by Gerald Appel. Moving Average Convergence/Divergence (MACD) is one of the simplest and most reliable indicator. MACD uses moving averages, which are follow-up signal numbers with trend following characteristics. It is used to strengthen the trend once it has been recognised. These indicators turn into oscillators when the longer moving average is subtracted from the shorter moving average. The result is a line oscillating below and above 0 with no lower or upper limits. The theory developed by Appel can be used to recognise a change in the trend and to recognise its direction. The process uses two exponential moving averages to determine the overbought and oversold levels. They are neither lower nor upper barriers, only a 0 axis around which the lines are fluctuating.
- Primary line. Usually illustrated by a straight line. Also called as quick MACD line. The line is the difference between the short-term and long-term exponential moving average of the market price (12/13 and 26 days or data):
[latex]FastMACD_{j}=EMAve_{j}(ClosingP,12)-EMAve_{j}(ClosingP,26)[/latex]
- Secondary line. Usually illustrated by a dashed line. Also called as slow MACD line or Signal line. It is the 9-day or n-data exponential moving average of the quick MACD:
[latex]SlowMACD_{j}=EMAve(FastMACD,n)[/latex]


MACD is the most frequently used formula and it uses the 26 and 12-days (EMA(26), EMA(12)) moving averages of the share. The indicator is faster and more sensitive when using a shorter MA and slower and less sensitive when using a longer MA. The two MAs building up the MACD work the following way: the 12-day EMA is faster and the 26-day EMA is slower. The indicator reflects the diverging and converging movement of three moving averages. However, only two lines are illustrated out of the three: the MACD and the Signal line. MACD line is calculated from two exponential moving averages (12, 26 EMA). It is the difference of the closing prices’ 12-day and 26-day exponentially weighted MAs. The Signal line is the 9-day exponentially weighted MA of the MACD line. When the MACD crosses the 9-day Signal line from below, the signal is Bullish. When the MACD crosses the Signal line from above, the signal is Bearish.
Bullish and bearish signals of the MACD
What does the MACD measure? MACD measures the difference of two exponential moving averages (EMA). A positive MACD means that the 12-day EMA is larger than the 26-day EMA. A negative MACD means that the 12-day EMA is smaller than the 26-day EMA. When the MACD is positive and increasing, the gap between the 12-day and 26-day EMA is also increasing. This simply means that the faster moving average changes more rapidly than the slower moving average. In this case the price movements signal a bullish period due to the increased momentum. When the MACD is negative and decreasing, the gap between the 12-day and 26-day EMA is increasing. In this case the price movements signal a bearish period due to the decreased momentum. The shorter and longer MAs are crossing each other at the MACD and the midline intersections.
Trading signals
Buying signals. The MACD gives a buying signal when one of the following events occur:
- Positive divergence.
- Crossing the Signal line (Bullish direction).
- Crossing the midline (Bullish direction).
Positive divergence happens when the MACD lines’ lowest points are increasing, while the share is still in an inclining trend phase and its lowest points are decreasing over time. Positive divergence is the least common from the three signals, but the most reliable. It signals a sudden future market price change.
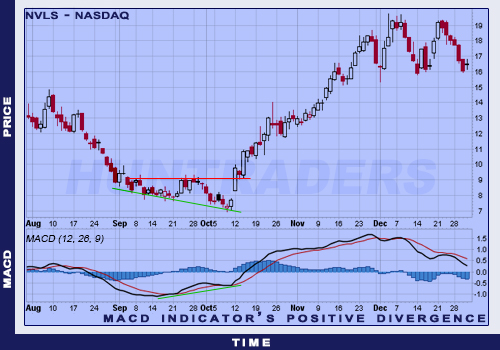
MACD indicator’s positive divergence
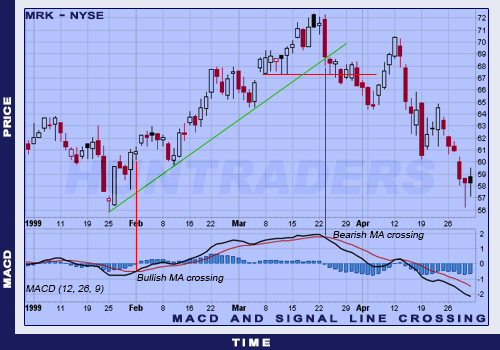
Crossing the Signal line (Bullish direction). Bullish direction Signal line-crossing happens when the MACD rises above the 9-day Signal line. This signal is the most common and has the lowest reliability. It is necessary to use other indicators and technical analysis tools to avoid reacting on false signals. The Bullish direction of the Signal line-crossing is usually used to confirm the positive divergence. It can be used as a buying signal if the MACD stays above the Signal line for at least three consecutive days after the intersection. The higher the intersection above 0 the stronger the signal.
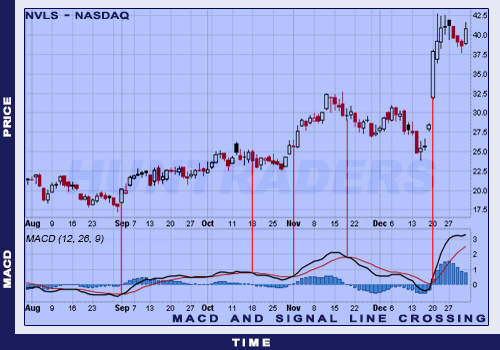
MACD and Signal line crossings
Crossing the midline (Bullish direction). Bullish direction midline-crossing happens when the MACD rises above the midline from a negative range to a positive range. It indicates clearly that the momentum shifted from negative to positive and the market changed from bearish to bullish. Bullish direction midline-crossing is a confirming signal after a positive divergence.
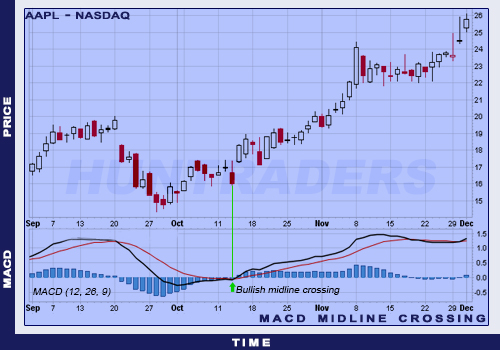
MACD midline crossing
Selling signals. The MACD gives a selling signal when one of the following events occurs:
- Negative divergence.
- Crossing the Signal line (Bearish direction).
- Crossing the midline (Bearish direction).
Negative divergence happens when the MACD lines’ highest points are decreasing, while the share is still in an ascending trend phase and its highest points are increasing over time. Negative divergence is the least common from the three signals, but the most reliable. It signals a sudden future market price change. There are two interpretations for the confirmation of the negative divergence:
- Firstly, when the indicator forms a lower low. With the lower peak and the consecutive lower low, the MACD’s ascending trend has shifted from bullish to bearish.
- Secondly, when the bearish-direction Signal line-crossing confirms the negative divergence. The longer time the MACD stays above the 9-day EMA, the harder to confirm (when does not decrease and form lower peaks). When the MACD crosses the 9-day EMA line, the indicator signals the weakness of the short-term trend and forms a temporary peak.
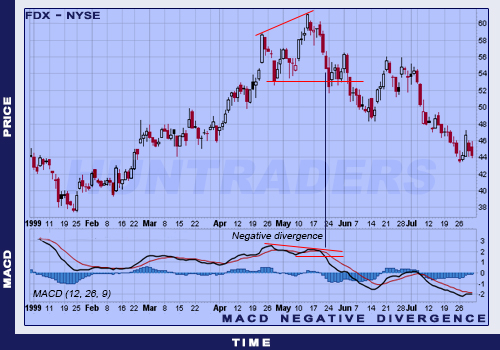
MACD indicator’s negative divergence
Crossing the Signal line (Bearish direction). Bearish direction Signal line-crossing happens when the MACD sinks below the 9-day Signal line. This signal is the most common and has the lowest reliability. It is necessary to use other indicators and technical analysis tools to avoid reacting on false signals. The Bearish direction of the Signal line-crossing is usually used to confirm the negative divergence. It can be used as a selling signal if the MACD stays below the Signal line for at least three consecutive days after the intersection. The lower the intersection below 0 the stronger the signal. Sometimes it can happen that the share is in an ascending trend and the MACD stays above the Signal line for a longer period. In this case, the development of a negative divergence is unlikely. Another kind of signal is going to be needed to recognise a change in the momentum. For instance, a break in the actual trend of the share can be a signal for that.
MACD and Signal line crossings
Crossing the midline (Bearish direction). Bearish direction midline-crossing happens when the MACD sinks below the midline from a positive range to a negative range. It indicates clearly that the momentum shifted from positive to negative and the market changed from bullish to bearish. Bearish direction midline-crossing is a confirming signal after a negative divergence.
The importance of a midline intersection depends on the prior movements of the MACD line. Bearish signal is when the MACD has a positive value for several weeks, then starts decreasing, and finally crosses the midline. However, it is only a correction when the MACD has been negative for several months, crosses the midline, and sinks back below. Other tradition technical analysis tools are needed to interpret the true meaning of a midline intersection event.
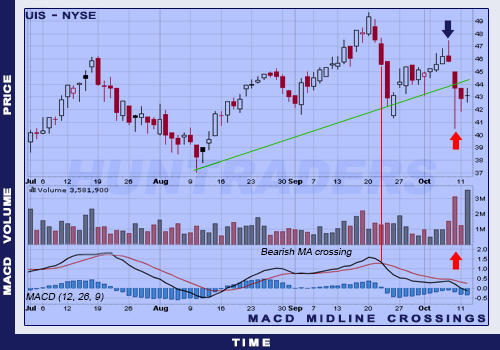
MACD and midline crossings
Use
The biggest advantage of the MACD is that the indicator combines the momentum and the trend aspects.
- It’s a trend-following indicator, so it mostly gives correct signals. The moving averages make it possible to follow the movements of the share prices. Using exponential moving averages (EMA) instead of simple moving averages (SMA) makes the indicator reacting faster to market changes.
- It’s a momentum indicator, so it can forecast the future movements of share prices.
The divergences indicate trend changes clearly. MACD can be used for daily, weekly, or monthly charts. The indicator reflects the converging and diverging movements of the moving averages. MACD parameters usually use 12- and 26-day moving averages. However, any other combination can be implemented. With experiments and optimisation, analysts can use different indicator values for different instruments. For weekly charts, the use of faster MAs is recommended. On rapidly changing markets, slower MAs give more punctual signals. MACD can be customised to fit the investor’s trading style. For example, closing prices can be replaced by average or opening prices, and exponential average can be replaced by applying linear weights. However, MACD indicator has several disadvantages as well:
- Moving averages (simple, exponential or weighted) always show past, historical data. Furthermore, MACD is the difference of two MAs, which can result inaccuracy. It is recommended to use weekly charts instead of daily ones. MACD Histogram is the solution for this problem.
- MACD is not appropriate to determine the oversold and overbought levels. Furthermore, MACD has neither upper nor lower limit.
- MACD is the absolute value of two MAs and not their percentage difference. MACD is calculated by subtracting one MA’s value from the other’s. When the share price increases, the gap between the two MAs also increases. Thus, MACD levels are difficult to compare in long-term, especially for shares which are increasing exponentially.
Since Gerald Appel developed the MACD, hundreds of other indicators appeared. Several has been developed and forgotten, but MACD has kept its popularity. It is because it’s simplicity and it’s the most commonly used indicator even today. MACD is an appropriate measurement for most of the markets and shares. The length of the MAs can be adjusted to fit the trading activity. Despite its reliability, MACD is also recommended to use with other methods.
Examples
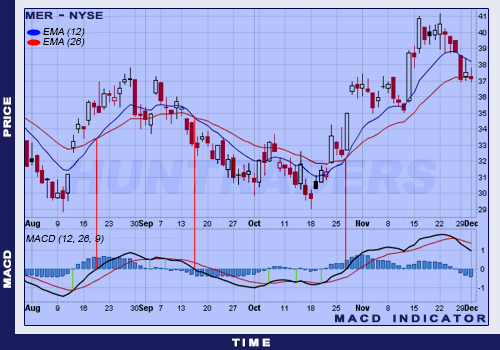
An analyst must observe two factors when evaluating MACD indicator results. One is, where is the MACD indicator compared to the zero level. When it is above, an ascending trend is about to develop. In this case, the trader has to think about opening long positions. When the indicator is below the zero level, an inclining trend is going to start and the trader should think about opening short positions. The farther the indicator from 0, the stronger the signal. The other factor is the way the MACD crosses the Signal line. When the MACD crosses from below, an increase or the continuation of an increase is expected. When the MACD crosses from above, a correction or a decrease is expected.
On the chart, the MACD is black, the Signal line is red, and the 0 line is the horizontal line. The MACD crosses the Signal line from below and rises above 0. Thus, indicating the start of an ascending trend. The chart shows this increase clearly. Then the MACD crosses the Signal line from above. This event signals that the long positions should be closed, but short positions should not be opened yet (as the price decrease can be a simple correction). The share prices start falling after the previously mentioned event. MACD sinks below the midline, and a lasting price decrease can be expected. The support line breaks and the share prices fall sharply. At the nadir, the MACD crosses the Signal line from below again. It could be a signal, but the indicator is still below the midline. Why is it risky to open a new position here? Because the inclining trend has not stopped yet and it is possible that the increase is just a correction. A long signal is only justified when the MACD is above the midline. This happens on the chart as well. Then another sell signal (closing long positions) is indicated, but short positions should only be opened once the MACD is below the midline.
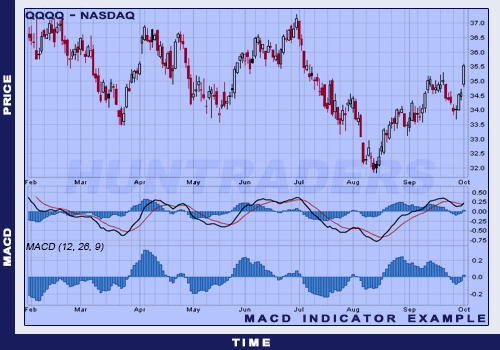
Example of MACD indicator’s trading signals