


Description and methodology
The indicator was developed by Donald Lambert. Commodity Channel Index (CCI) identifies the cycles in the stock prices. It is based on the principle that share prices show cyclicality consisting of consecutive high and low values. Lambert used 1/3 of the whole cycle for the CCI indicator. The time frame is determined independently from the CCI. When a cycle lasts 20 days, a 20-day CCI is recommended. CCI indicator is calculated by following these 4 steps:
- Calculate the last period’s average price (or typical price),
[latex]TypicalPrice=\frac{MaxPrice+MinPrice+ClosePrice}{3}[/latex]
Make a new time series data based on the formula above.
- Calculate an n-day SMA from the data (SMA of the Typical Price (SMATP)):
[latex]SMATP_{j}=SMA\left ( TypicalPricer_{j},n \right )[/latex]
- Calculate the mean deviation, the average of absolute differences. First calculate the absolute value of the difference of the Typical Price and the SMATP. Then sum the n-day data and divide the result with n:
[latex]MeanDeviation_{i}=\frac{1}{n}\times \sum_{j=i-n}^{i}\left | TypicalPrice_{j}-SMATP_{j} \right |[/latex]
- The CCI formula is the following (0.015 is a constant value):
[latex]CCI_{j}=\frac{TypicalPrice_{j}-SMATP_{j}}{0.015\times MeanDeviation_{j}}[/latex]
CCI is moving between -100 and +100 in 70-80% of the cases (neutral zone). The smaller the time frame, the more signals the CCI gives. It is recommended to use 10 or 30 days.


Trading signals
- Identify oversold/overbought levels. The share is oversold when CCI is below -100. It is overbought when CCI is above +100. There is a long signal after an oversold state when the CCI is again above -100. There is a short signal after an overbought state when the CCI is again below +100.
- Divergences. Divergences between the share price and the indicator give important signals. A positive divergence when CCI rises above -100 means a possible share price increase. A negative divergence when CCI sinks below +100 means a possible share price decrease.
- Trend lines. Several signals can be observed from trend lines. To get the lines, the peaks and troughs of the CCI curve have to be connected. There is a long signal when the trend line crosses the -100-line from below at an oversold market state. There is a short signal when the trend line crosses the +100-line from above at an overbought market state.
Use
Investors use the CCI indicator to determine reversals, extreme share prices or the trend’s strength. It is recommended to use it together with other indicators.
Examples
The following example is about Yahoo’s share. It shows the 20-day CCI indicator. In March 2004, the share price rose above USD 23 and doubled its price in the following few months. The CCI remained below +100, but the share price kept on increasing. CCI was above +50 in June and July, but the CCI values below +100 gave false signals to close the position. It is recommended to use the CCI together with other indicators and to pay attention to the unique nature of the different shares.
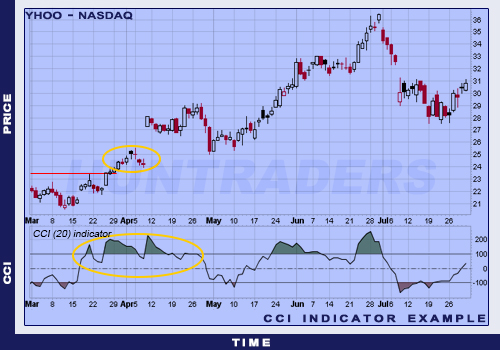
Overbought and oversold levels on the CCI indicator