


Description and methodology
Bollinger Bands are classical elements of the technical analysis. It has the ability to give hints about the direction of share prices. The indicator was developed by John Bollinger who wanted to have a compact solution to compare a share’s volatility and its relative price level in a given period. The indicator consists of three curves, forming bands that border the share price chart:
- Middle band is the basis, an SMA (usually 20-day).
- Upper band at K times an N-period standard deviation above the SMA.
- Lower band at K times an N-period standard deviation below the SMA.


The bigger the volatility, the wider the gap between the bands. Furthermore, the gaps between the middle and the upper and the middle and the lower band is always equal. The share price is usually not similar to the middle band. The two most influencing factors are the width of the gap and the position of the share price relative to the upper and lower band. Using Standard Deviation is a good way to measure volatility. The bands react to price changes quickly and can show the high and low volatility periods in the analysed period. The bands are going to widen if there is a sudden price change (consequently an increased volatility as well). The indicator reacts to changes in the volatility immediately.
The calculation is the following:
[latex]MiddleBand_{j}=SMA(ClosePrice,j-n)[/latex]
[latex]UpperBand_{j}=MiddleBand_{j}+k\times StdDev(ClosePrice_{j})[/latex]
[latex]LowerBand_{j}=MiddleBand_{j}+k\times StdDev(ClosePrice_{j})[/latex]
[latex]StdDev(ClosePrice_{j})=\sqrt{\frac{\sum_{i=j-n}^{j}(ClosePrice_{j}-MiddleBand_{j})^{2}}{n}}[/latex]
- MA calculation. Calculate an SMA for a certain n period. Usually 20-day SMA is used.
- SD calculation. Calculate the standard deviation: the 20 days’ closing prices are subtracted from the average of the closing prices and square the results. Then sum the squares and divide them by 20. Finally, calculate the square root of that.
Closing price is the most commonly used parameter for the calculation of Bollinger Bands. Sometimes Typical Price or Weighted Price are also used:
[latex]TypicalPrice=\frac{MaxPrice+MinPrice+ClosePrice}{3}[/latex]
[latex]WeightedPrice=\frac{MaxPrice+MinPrice+ClosePrice+ClosePrice}{4}[/latex]
When using Typical Price, the calculation is the following:
[latex]MiddleBand=SMA(TypicalPrice)[/latex]
[latex]UpperBand=MiddleBand+k\times StdDev(TypicalPrice)[/latex]
[latex]LowerBand=MiddleBand+k\times StdDev(TypicalPrice)[/latex]
Bollinger indicator uses 20-day SMA, which is shifted by the double value of the SD to get the two sides of the channel. The length of the MA and the SD is always adjusted to the specific share. For long-term analysis, a 50-day MA is used and the MA is shifted by the triple value of the SD.
Trading signals
- Double bottom (long signal). There is a double bottom when the prices sink below the bottom band, then rise above the band, and again form a low. It does not matter which low is the lower. The second trough must stay above the bottom band. The long signal is confirmed if the share price has risen above the middle band.
- Double top (short signal). There is a double top when the prices rise above the top band, then sink below the band, and again form a high. The short signal is confirmed if the share price has sunk below the middle band.
- Channel narrowing. The most important signal of the Bollinger Bands. The narrowing signals that the volatility has decreased. The outside bands approach the middle band. After a tightening, a significant change in the price can be expected in the direction in which share price starts to move. To determine the direction, other indicators should be used as well.
- Signals the overbought and oversold market. A market is oversold or overbought if the prices are too high/low and they are expected to return. When the share price is close to the lower band, the market is oversold. When the share price is close to the upper band, the market is overbought. This signal is the most reliable on trendless markets.
- Sell and buy signals. When the Bollinger Band is displayed with another oscillator (e.g. RSI), the oversold/overbought signal with a divergence signals selling or buying opportunities.
- Signals upcoming price changes. The bands usually narrow before a sharp price change (the reason of that is a change in the volatility).
- Marks possible highs and lows. If the share price breaks the upper band twice, it may be the potential peak of the price. If the share price breaks the lower band twice, it may be the potential trough of the price.
Use
Bollinger Bands use the following time parameters:
- in short-term a 10-day SMA is recommended,
- in medium-term a 20-day SMA is recommended,
- in long-term a 20-day SMA is recommended.
Bollinger Bands can identify high and low volatility periods and extremely high or low share price levels. They give sell/buy signals, but do not show the direction of the possible price change. It is recommended to use Bollinger Bands together with other indicators. For example, with RSI:
- If the price rises above the upper band, but the RSI is not in an extreme range (above 70), there is a continuation of the ascending trend.
- If the price sinks below the lower band, but the RSI is not in an extreme range (above 30), there is a continuation of the descending trend.
- There may be a trend reversal when the share price is outside the upper and lower bands and the RSI is in the extreme range.
Basic principles:
- If the price touches one of the bands, it will sooner or later touch the other one as well.
- There is a strong trend if the share price follows one of the bands.
- A sharp price change can be expected when the channel tightens.
- There may be a trend reversal if the share price forms an extreme point outside the upper and lower bands and then forms the next minimum/maximum between the bands.
- If the share prices cross one of the bands, a trend continuation can be expected.
When the channel is wide:
- If the price touches one of the bands, it will sooner or later touch the other one as well.
- When a price change starts from one band, it will usually last until the other band.
- When the share price is outside the channel, traders can expect a continuation in the trend. It will return to the channel: either have a correction or wait for the channel to move.
The most important question is which time frame to use for the MA calculation and what multiplier to use for the SD. This requires lots of practice and testing for different markets and instruments. If the investor does not rely heavily on Bollinger Bands, the testing may not be necessary. In this case, the goal is to have the share price within the channel 85-95% of the time. If the share price breaks out from the channel too often, a longer MA might be more relevant. The indicator should not be used alone as it may result unnecessary risks. The most commonly used signal is when the share price touches the channel after a relatively low volatility period. If the lower band is touched, long positions will make profits. If the upper band is touched, short positions will make profits. The success of the strategy depends on the market and the situation to a great extent.
Common patterns on the chart can also give hints. There is a double bottom when the prices sink below the bottom band, then rise above the band, and again form high within the channel. The share price must rise above the middle band after the second trough. Double top is very similar to double bottom. It happens when the prices rise above the upper band, then sink below the band, and again form a high point within the channel. The confirmation here is when the share price crosses the middle band from above.
Bollinger Bands can be used on Candle charts. Traders should pay attention when prices are outside the channel and return to the channel suddenly. Shadows of the candle forms should be observed carefully. When the share price broke out of the top border of the channel, it will leave a upper shadow. When the volume is large, a correction can be expected. The same thing works downwards as well. There are several other ways to use Bollinger Bands.
Examples
The table below uses a 20-day MA to build up the Bollinger Band calculation.
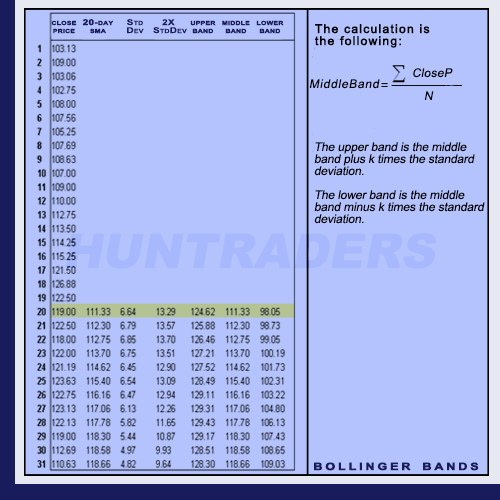
Bollinger Bands formula and calculation example
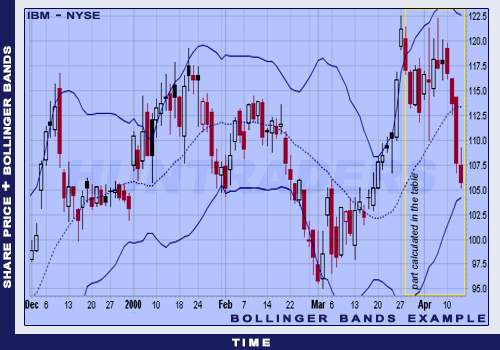
Bollinger Bands example for a given time frame
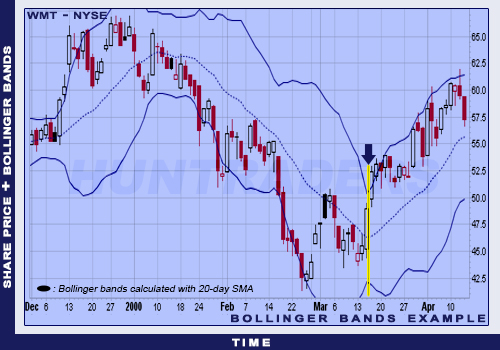
Bollinger Bands with 20-day SMA
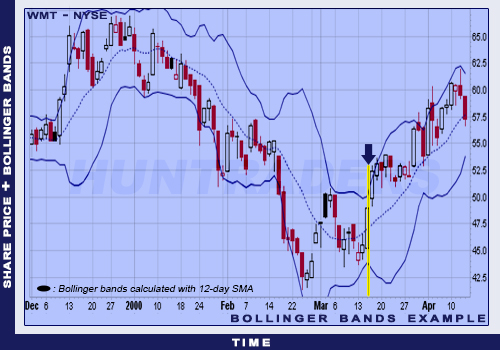
Bollinger Bands with 12-day SMA
The first example is calculated with a 20-day SMA, the second with a 12-day SMA.