


Description and methodology
Bollinger Bands Width shows the distance of the two bands. For this indicator, only the SD has significance. The width is calculated the following way:
[latex]BandWidth=2\times k\times StdDev(TypicalPrice)[/latex]
Trading signals
Bollinger Bands measure the volatility of a given instrument by using moving averages. The bands are shifted MAs. If the MA changes, the bands will follow the change. The width shows when the channel is tightening or widening. After a low volatility period, the bands may widen and the Bollinger Bands Width will increase. After a high volatility period, the bands may tighten and the Bollinger Bands Width will decrease. There is a tendency for the changes of the widening-tightening periods. When the width is large, it may mean the end of a trend. When the width is small, it may mean the start of a new trend.


Use
Why isn’t the standard deviation used if other parameters are not needed? The Bollinger indicator can be used in different ways, for which the width is always needed. The Bollinger Bands Width is recommended to be used as a percentage value, so the different instruments are comparable.
Examples
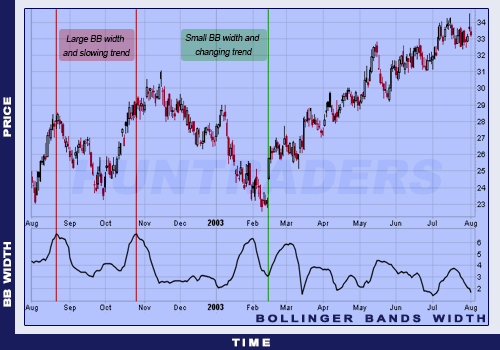
Bollinger Bands Width indicator example