


Description and methodology
Average Directional Index (ADX) was developed by J. Welles Wilder in 1978. The aim of the index was to determine whether the market is in a trend-like or a trendless phase. The fact whether there is a trend is important for other indicators as well, as they may signal differently when it is known what kind of trend is present on the market. ADX is a value between 0 and 100. However, values above 60 are very uncommon. Values below 20 indicate a weak trend and values above 40 indicate a strong trend. The ADX indicator cannot tell the direction of the trend, only its strength. An ADX value above 40 can mean both a strong ascending and a strong inclining trend. It can help the trader recognise a change in the trend early. If ADX is below 20, it signals the end of a trend. When the value is above 20, it signals the development of a trend. If ADX is below 40, it signals the decline of a trend. When the value is above 40, it signals the continuation of a trend.
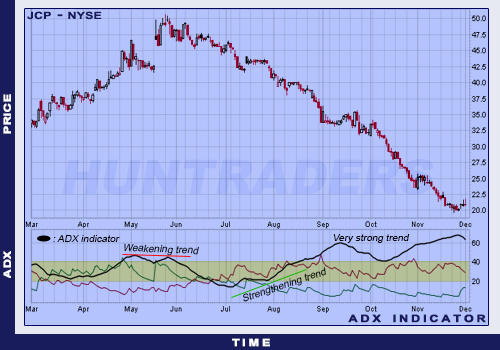
Different signals of the ADX indicator: weak trend, developing trend, and very strong trend


Wilder has developed the following two indicators of the ADX:
- Positive Directional Indicator, +DI: measures the strength of the increasing market force in a given period.
- Negative Directional Indicator, -DI: measures the strength of the decreasing market force in a given period.
Different signals of the ADX indicator: descending trend and ascending trend
The ADX indicator is the smoothed version of the DX line, where DX measures the strength of the trend. The formula of Wilder’s version of the ADX is the following:
[latex]+DM_{j}=High_{j}-High_{j-1}[/latex]
[latex]-DM_{j}=Low_{j-1}-Low_{j}[/latex]
[latex]TR_{j}=max\left ( \left | Low_{j}-Close_{j-1} \right |,\left | High_{j}-Close_{j-1} \right |,\left | High_{j}-Low_{j} \right | \right )[/latex]
[latex]+SDI_{j}=\frac{+DM_{j}}{TR_{j}}[/latex]
[latex]-SDI_{j}=\frac{-DM_{j}}{TR_{j}}[/latex]
[latex]+DI_{j}=EMA_{j}\left ( +SDI_{j,n} \right )[/latex]
[latex]-DI_{j}=EMA_{j}\left ( -SDI_{j,n} \right )[/latex]
[latex]DX_{j}=\frac{\left | \left ( +DI_{j} \right )-\left ( -DI_{j} \right ) \right |}{\left | \left ( +DI_{j} \right )+\left ( -DI_{j} \right ) \right |}\times 100[/latex]
The value of ADX is obtained by calculating the average:
[latex]ADX_{j}=EMA_{j}\left ( DX,n \right )[/latex]
Trading signals
An ADX curve above a predefined limit indicates a trend. ADX curve below the predefined value indicates a trendless market. The trading signals are usually given by the intersections of the +DI and -DI lines.
- Comparing different instruments. When analysing two or more instruments in the same time, the comparison of ADX values can help to decide which instrument has a stronger trend-like movement.
- Signalling trend direction. When the +DI curve is above the -DI curve, the trend is ascending. When the -DI curve is the one above, the trend is downwards.
- Sell and buy signals. Sell and buy signals are generated by the +DI and -DI curves. When +DI curve crosses the -DI curve upwards, the purchase of the instrument is recommended. When -DI curve crosses the +DI curve downwards, the instrument should be sold. The signals are the most certain when ADX curve indicates a trend on the market.
Sideways markets should be treated carefully, because indicators cross each other frequently in such situation. +DI/-DI intersections should be used along with other technical analysis tools for trading decisions.
Use
The ADX is the combination of +DI and -DI, smoothed out in a way to measure the strength of the trend. Therefore, ADX cannot signal the direction of the trend, only its strength. Usually an ADX value above 40 means a strong trend and an ADX below 20 means a weak trend. Trader should pay attention to shares with ADX values increasing above 20. This way the trend can be recognised in its early stage. When the ADX of a share decreases below 40, the weakening of the trend and the development of a sideways market can be expected.
Examples

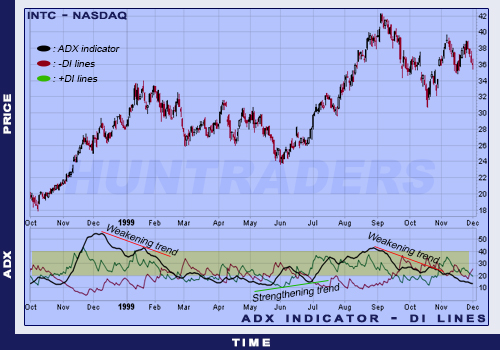
Different signals of the ADX indicator on the chart of Intel Corp. The signals of a weakening and a strengthening trend