Scaling stock prices refers to the process of adjusting the vertical axis of a stock chart to account for large price movements. There are two main methods of scaling stock prices: arithmetic scaling and logarithmic scaling.
Arithmetic scaling, also known as linear scaling, adjusts the vertical axis of the chart by equal increments. This means that the same distance on the chart represents the same price change, regardless of the actual stock price. Arithmetic scaling is best suited for charts where the price movements are relatively small, as it provides a good representation of small price movements and trends.
Logarithmic scaling, on the other hand, adjusts the vertical axis of the chart using logarithmic increments. This means that the same percentage change in stock price is represented by the same vertical distance on the chart, regardless of the actual price of the stock. Logarithmic scaling is best suited for charts where the price movements are large, as it provides a better representation of large price movements and trends.
Both arithmetic and logarithmic scaling have their advantages and disadvantages, and the choice of scaling method will depend on the specific needs of the analyst and the type of stock being analyzed. It is important to use the appropriate scaling method to accurately represent the price movements of the stock and to avoid distorting the data.
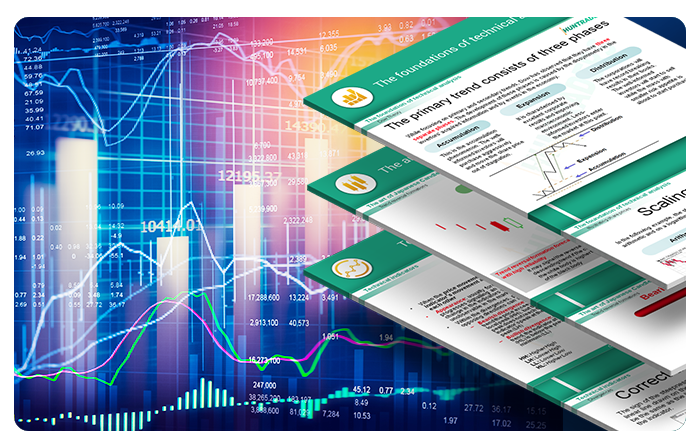
The linear and logarithmic scaling methods are show on the same chart.